ISSN: 1839-9940

 Global reach, higher impact
J Genomics 2018; 6:9-19. doi:10.7150/jgen.23222 This volume Cite
Research Paper
Constructing a 'Chromonome' of Yellowtail (Seriola quinqueradiata) for Comparative Analysis of Chromosomal Rearrangements
Junya Kawase1 ![]() , Jun-ya Aoki2, Kazuo Araki1,2
, Jun-ya Aoki2, Kazuo Araki1,2
1. Department of Life Sciences, Graduate School of Bioresources, Mie University, Tsu city, Mie Prefecture, Japan;
2. National Research Institute of Aquaculture, Fisheries Research Agency, Tamaki-cho, Mie Prefecture, Japan.
Received 2017-10-8; Accepted 2017-11-18; Published 2018-1-1
Abstract

To investigate chromosome evolution in fish species, we newly mapped 181 markers that allowed us to construct a yellowtail (Seriola quinqueradiata) radiation hybrid (RH) physical map with 1,713 DNA markers, which was far denser than a previous map, and we anchored the de novo assembled sequences onto the RH physical map. Finally, we mapped a total of 13,977 expressed sequence tags (ESTs) on a genome sequence assembly aligned with the physical map. Using the high-density physical map and anchored genome sequences, we accurately compared the yellowtail genome structure with the genome structures of five model fishes to identify characteristics of the yellowtail genome. Between yellowtail and Japanese medaka (Oryzias latipes), almost all regions of the chromosomes were conserved and some blocks comprising several markers were translocated. Using the genome information of the spotted gar (Lepisosteus oculatus) as a reference, we further documented syntenic relationships and chromosomal rearrangements that occurred during evolution in four other acanthopterygian species (Japanese medaka, zebrafish, spotted green pufferfish and three-spined stickleback). The evolutionary chromosome translocation frequency was 1.5-2-times higher in yellowtail than in medaka, pufferfish, and stickleback.
Keywords: Acanthopterygii, chromosome evolution, de novo assembly, radiation hybrid map, synteny analysis, whole-genome sequencing
Introduction
Fishes were the first vertebrate group to evolve and are consequently an extremely diverse taxon that can be categorized in various ways. Fishes comprise more than 50% of all vertebrate species and are characterized by a range of morphologies, behaviors and habitat use [1]. This high level of biodiversity is a powerful basis for studying genome evolution. Fish diversity can be roughly equally divided into species from marine and freshwater ecosystems. Geographical isolation is believed to have greatly influenced the evolution of freshwater fishes because intraspecific variation can occur from local adaptive differences as a result of reproductive isolation or from physical barriers to movement for wide-ranging species. Most marine fishes live in coastal waters over relatively shallow continental shelves, with roughly only 13% of species inhabiting the open ocean. Compared with freshwater fishes, marine fishes have evolved more varied forms and sizes, allowing them to fill a wide range of aquatic niches [2-4]. Genome duplication plays an important role in the process of evolution, and two rounds of whole-genome duplication (WGD) are understood to have led to the increased size and complexity of vertebrate genomes [5]. Teleosts are the most derived fishes: they are overwhelmingly the dominant group of bony fishes, with nearly 30,000 recognized species, comprising about 96% of all extant fish species. In the common ancestor of the teleost lineage, an additional round of polyploidization, called the teleost-specific WGD, occurred 226-350 million years ago [6-9]. This polyploidization event influenced evolution of the structural and functional gene diversity of teleosts [10] since one of the duplicate genes can shift towards a new function (neofunctionalization) or both copies can subfunctionalize. Additional WGD events occurred independently in numerous species, including higher-level taxa of teleosts and other ray-finned fishes (for example, salmonids, carp and sturgeon), thus some fish lineages have experienced at least four rounds of WGD since the origin of vertebrates. Therefore, teleost genomes are good models for understanding the significance of WGD during evolution and for discovering why the genomes of teleost species underwent the additional duplication [11].
The teleost species most represented in genome studies are spotted green pufferfish (Tetraodon nigroviridis) [12], Japanese medaka (Oryzias latipes) [13], three-spined stickleback (Gasterosteus aculeatus) [14], zebrafish (Danio rerio) [15], Atlantic salmon (Salmo salar) [16], and common carp [17,18]. Chromosome-level genome assemblies of these five species are available in the NCBI Genome Database [19]. Chromosome-level assemblies or assembled genome sequences integrated with genetic maps, termed 'chromonomes,' are powerful tools that enable analyses of conserved syntenies among species [20]. The detection of conserved syntenies can provide valuable information, including, for instance, insights into chromosomal rearrangements that occurred during evolution. Hence, these five genome assemblies have been used in comparative genomic studies of teleost species.
The jacks of the family Carangidae are an important group of marine teleosts and several species of the genus Seriola have become the basis for prosperous aquaculture. However, insufficient genome information exists on species of Seriola as well as which species are close to Seriola in their genome structure. The Japanese amberjack Seriola quinqueradiata Temminck & Schlegel 1845, also called yellowtail, is native to the northwest Pacific, around the Korean Peninsula and parts of Japan. It is hypothesized that yellowtail spawn around Tanegashima, one of the Ōsumi Islands belonging to Kagoshima Prefecture; juveniles are found among macroalgae floating with ocean currents towards the coastline, where they are caught for a thriving aquaculture industry in Japan. The ecological characteristics of yellowtail differ from those of other teleosts for which genome sequences are available. Hence, we might expect studies of the yellowtail genome to reveal new information about fish genome evolution.
We have worked on developing radiation hybrid (RH) physical maps and a genetic linkage map because of the species' economic importance [21,22]. On a physical map, intervals between genes show physical distance, unlike on a linkage map, and so scaffolds of genome sequences can be easily lined up using a physical map. Hence, we concentrated on developing a physical map of yellowtail using an RH mapping panel.
In this study, we lined up genome sequences of yellowtail using an updated RH physical map, and mapped 13,977 expressed genes on the physical sequence map. Thus, we could accurately compare synteny relationships between yellowtail chromosomes and chromosomes of four model fish species. Here, we report the yellowtail 'chromonome,' which denotes genome sequencing integrated with an RH map to identify the chromosomal order of the scaffolds; we also compare the yellowtail genome structure with that of model fishes and the spotted gar (a non-teleost) in order to identify characteristics of the yellowtail genome. For non-teleost fishes, a chromosome-level genome assembly of the spotted gar (Lepisosteus oculatus) has been reported [23]. Spotted gar is an ancient fish species, the lineage of which diverged from the teleost lineage before the teleost-specific WGD event occurred [24]. Hence, the spotted gar makes an ideal outgroup for the investigation of teleost genes and genome evolution. Whereas gars make good genomic and laboratory models, other groups of non-teleost ray-finned fishes (i.e., bichirs, sturgeons, paddlefish, and bowfin) are problematic due to derived morphologies, lineage-specific polyploidizations, and/or difficult husbandry [20]. Using the spotted-gar genome as a reference, we further documented synteny relationships and evolutionary chromosomal rearrangements in four acanthopterygian species (yellowtail, Japanese medaka, spotted green pufferfish, and three-spined stickleback). We found that the yellowtail chromosome structure was most closely related to that of medaka, and that the evolutionary chromosome translocation frequency was 1.5-2-times higher than that of the other fish species studied.
Materials and Methods
Obtaining yellowtail genome and transcriptome sequences
The National Research Institute of Aquaculture, Japan, has been developing de novo whole-genome sequences and transcriptome sequences of yellowtail (Seriola quinqueradiata). We obtained yellowtail genome sequences (BDMU01000001-BDMU01000384) and transcriptome sequences (IACH01000001-IACH01013125) from the DNA Data Bank of Japan (DDBJ).
Designing the primer pairs for RH mapping
To orient the genomic scaffolds, primer pairs were designed on a genome sequence for RH mapping. The first primer pairs (product size 150-200 bp) were designed from the sequences, and the nested primer pairs (product size 100-150 bp) were designed from the first-round PCR products using Primer3 [25] for expression analysis with the BioMark HD system (Fluidigm, CA, USA).
Construction of an RH map
The RH panel, comprising 93 RH cell lines and positive and negative controls, was previously published by Aoki et al. [21]. DNA from each cell line was extracted using a Blood and Cell Culture DNA Midi Kit (Qiagen, Hilden, Germany). Genotyping reactions were carried out on a Fluidigm platform using the BioMark 96.96 Dynamic Array for gene-expression analysis, as described previously [21].
CarthaGène software [26] was used to perform two-point linkage analyses and to determine the marker order and inter-marker distances in centiRays (cRs). CarthaGène looks for multiple populations' maximum-likelihood consensus maps using a fast expectation-maximization algorithm for maximum-likelihood estimation and powerful ordering algorithms. The group command at a logarithm of the odds (LOD) threshold of 4.0 and a distance threshold of 50 determined the linkage groups, and we used the previous RH map of yellowtail as the reference [27].
Construction of the 'chromonome'
A nucleotide-to-nucleotide BLAST (blastn) search of yellowtail expressed sequence tags (ESTs) was performed against the yellowtail genome sequences with the cut-off e-value 1e-10. If the e-value of the top hit was greater than half the e-value of the second hit, the combinations of sequences were removed from subsequent analyses. We determined the position and direction of each of the genome sequences based on the RH map and the result of a BLAST search between ESTs and the genome sequences.
Comparative genomic analysis
The locations of the ESTs were positioned on the genome sequences of the RH map, and the mapped ESTs were used for comparative analysis.
The complementary DNA (cDNA) sequences of medaka, spotted green pufferfish, three-spined stickleback, and spotted gar were obtained from Ensembl [28].
Translated-nucleotide-to-translated-nucleotide BLAST (tblastx) searches were performed against the yellowtail, medaka, spotted green pufferfish, three-spined stickleback, and spotted gar cDNA sequences to detect orthologs, using an e-value cut-off of 1e-5 and reciprocal best hits. The orthologs were aligned to the genetic map of each species to identify syntenic relationships. We constructed Oxford grids [29] and Circos plots [30] to compare the genomic data of yellowtail and four other teleost species: medaka, spotted green pufferfish, three-spined stickleback, and zebrafish.
The orthologs between spotted gar (a non-teleost) and the other species were aligned to the genetic map of spotted gar [23]. We compared the syntenic relationships of each of the four species with spotted gar to find chromosomal rearrangements in the ray-finned fishes (Acanthopterygii). The regions that had different syntenic relationships were considered to be the regions that underwent chromosomal rearrangements. If the region had a conserved syntenic relationship with spotted gar in medaka chromosome but not in yellowtail chromosome, the segment in the region was considered to have undergone chromosomal rearrangement in the yellowtail lineage.
Results and Discussion
Constructing the yellowtail 'chromonome'
The two-point analysis performed with a distance threshold of 50 and a logarithm of the odds (LOD) score of 4.0 resulted in 117 RH groups. We newly mapped 181 markers on the updated RH map, and 61 of the RH groups, containing a total of 1,713 markers, were assigned to 24 linkage groups (LGs). Thus, the RH map here was constructed with a set of 1,713 markers (available in a data repository [31]). In each group, the RH map ranged from 645.3 to 1,874.5 cR, with an average of approximately 1,263.1 cR. The combined size of all the RH groups was 30,314.5 cR. The final RH map constructed in this study has a higher marker density than other available physical maps [32-34].
Whole-genome de novo sequencing of yellowtail was developed at the National Research Institute of Aquaculture, Japan, utilizing the Illumina HiSeq 2500 and PacBio RS II platforms. The project produced 149 Gbp of data by Hiseq2500, and 14.5 Gbp by PacBio RS II, with total coverage at about 200-fold (the sequence data have been deposited in the DDBJ). The final de novo genome assembly was 639.3 Mbp long, with 384 scaffolds, and an N50 scaffold size of 5.6 Mbp. These results imply a value of 1 cR = 22.1 kbp (i.e., 639 Mbp/30,314.5 cR).
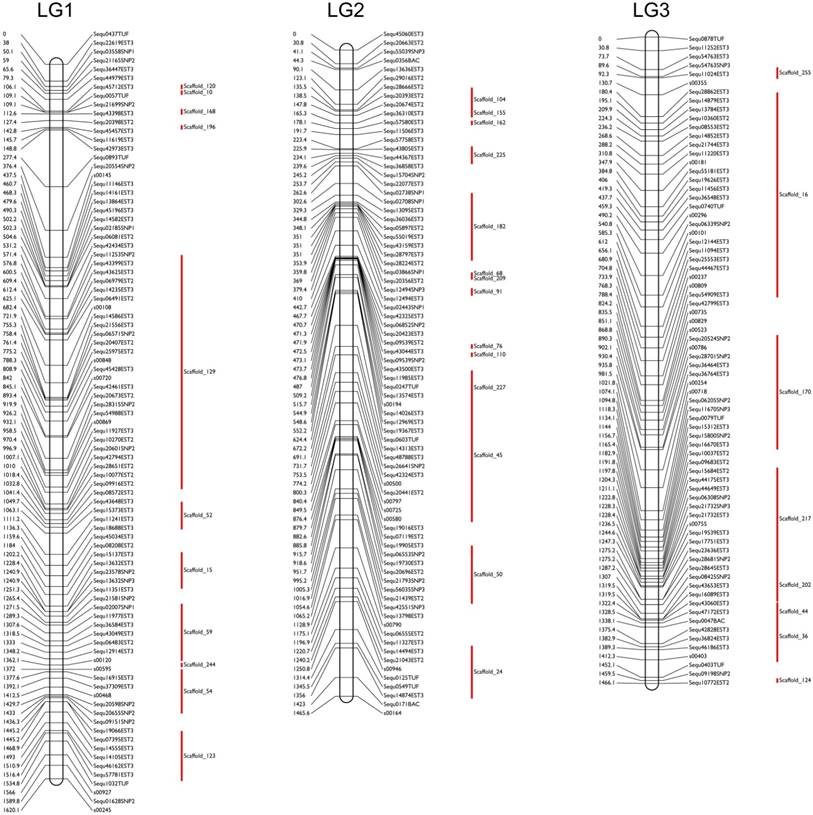
The sequences of the mapped markers of yellowtail were used for BLAST searches against the yellowtail genome sequence assembly, and we anchored 200 scaffolds with a total length of 601 Mb (93.9% of the total size of the genome scaffolds) to the RH map (Figure 1, Table 1; [31]). The number of anchored scaffolds per LG ranged from 2 to 18. A total of 13,977 ESTs (21.2 Mbp) were mapped to the anchored genome sequences. With these results, we constructed a high-density physical map with 13,977 ESTs (1 EST/46 kbp). The RH map was very useful to anchor the assembled genome sequences and thereby to construct a high-density physical map. To extend the length of anchored sequences, we continued our development of the physical map using the RH panel.
Examples of the fine radiation-hybrid physical map used and the anchored scaffold sequences in this study. Marker names are indicated on the right sides of each chromosome-pattern diagram; red bars indicate the anchored scaffold sequences. The marker distances in centiRays (cRs) are indicated on the left sides of each diagram.
Summary statistics of scaffold mapping onto the yellowtail radiation hybrid physical map
| chromosome name | the number of markers | the number of scaffolds | the number of bases |
|---|---|---|---|
| LG1 | 89 | 11 | 32,286,024 |
| LG2 | 78 | 14 | 31,041,142 |
| LG3 | 74 | 8 | 27,823,149 |
| LG4 | 84 | 8 | 29,237,640 |
| LG5 | 49 | 2 | 20,020,530 |
| LG6 | 73 | 3 | 26,000,068 |
| LG7 | 66 | 2 | 21,781,103 |
| LG8 | 71 | 7 | 25,028,737 |
| LG9 | 84 | 6 | 33,152,221 |
| LG10 | 74 | 7 | 24,257,723 |
| LG11 | 38 | 6 | 12,614,074 |
| LG12 | 106 | 11 | 24,187,425 |
| LG13 | 69 | 9 | 25,900,440 |
| LG14 | 65 | 17 | 24,241,979 |
| LG15 | 88 | 8 | 29,758,787 |
| LG16 | 71 | 15 | 28,118,061 |
| LG17 | 78 | 18 | 18,004,360 |
| LG18 | 67 | 6 | 25,909,367 |
| LG19 | 73 | 6 | 26,430,848 |
| LG20 | 64 | 3 | 26,418,531 |
| LG21 | 64 | 8 | 20,712,578 |
| LG22 | 54 | 8 | 14,276,494 |
| LG23 | 64 | 2 | 23,995,207 |
| LG24 | 94 | 15 | 29,390,724 |
| total | 1737 | 200 | 600,587,212 |
| average | 72.4 | 31.7 | 23,785,580 |
A linkage map of yellowtail was constructed by Fuji et al. [22]. When the updated RH map and the linkage map were compared, we found that some regions that appeared narrow in the linkage map remained wide in the RH map. The inconsistency in these regions may reflect the rare occurrence of recombination events, which may indicate that the regions correspond to centromeres. The yellowtail karyotype consists of one set of metacentric, one set of submetacentric, and 22 pairs of acrocentric chromosomes [21]. Therefore, we suggest that LG12 may be a submetacentric chromosome, and LG13 may be a metacentric chromosome.
Comparative analysis of chromosomal rearrangements
Although we previously investigated the conservation of synteny between yellowtail and four model fishes [27], the newly constructed ultra-high-density yellowtail physical map has enabled more-accurate comparisons of the syntenic relationships between yellowtail and the other fishes.
Synteny analysis with the 13,977 mapped ESTs was performed using tblastx searches against the cDNA sequences of five species: medaka, spotted green pufferfish, three-spined stickleback, zebrafish, and spotted gar (Table 2). A total of 6919, 6379, 7378, 6882, and 6522 yellowtail sequences had orthologs in medaka, pufferfish, stickleback, zebrafish, and gar, respectively.
Summary of each BLAST search (tblastx). Reciprocal BLAST searches were executed to detect Reciprocal Best Hit (RBH).
| yellowtail | RBH | ||
|---|---|---|---|
| target | query | ||
| medaka | 19,743 | 13,403 | 6,919 |
| pufferfish | 18,965 | 13,172 | 6,379 |
| stickleback | 22,639 | 13,879 | 7,378 |
| zebrafish | 39,265 | 10,897 | 6,882 |
| spotted gar | 17,888 | 13,490 | 6,522 |
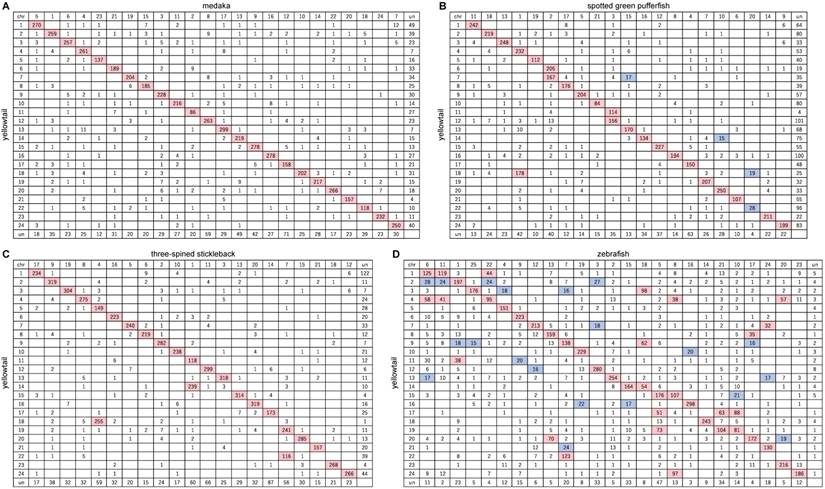
Between yellowtail and medaka, 5665 of the orthologs were located in the 24 LGs of yellowtail and 24 chromosomes of medaka, and 92.3% of them were contained in major conserved groups shown in an Oxford grid (Figure 2A). The chromosomes of these two species showed one-to-one correspondence (Figure 3A). The remaining 1254 orthologs were mapped to un-anchored scaffolds or were not mapped to scaffold sequences. Almost all regions of the yellowtail and medaka chromosomes were conserved, and some blocks comprising several markers were translocated (Figure 2A, Figure 3A). This result is consistent with the results of a previous phylogenetic study by Betancur-r. et al.[35], which indicated that yellowtail and medaka are phylogenetically close, although yellowtail and medaka are remarkably different in body form, size, and habitat.
Oxford grids showing conservation of synteny between yellowtail Seriola quinqueradiata and four model ray-finned fishes. A: Japanese medaka, B: spotted green pufferfish, C: three-spined stickleback, and D: zebrafish. Rows correspond to yellowtail linkage groups. Columns correspond to chromosomes of the model fish. The number in each square indicates the number of orthologs. Rows and columns labelled 'un' indicate the number of unlocated orthologs. White squares indicate 0-14 orthologs, blue squares 15-30 orthologs, and pink squares >30 orthologs.
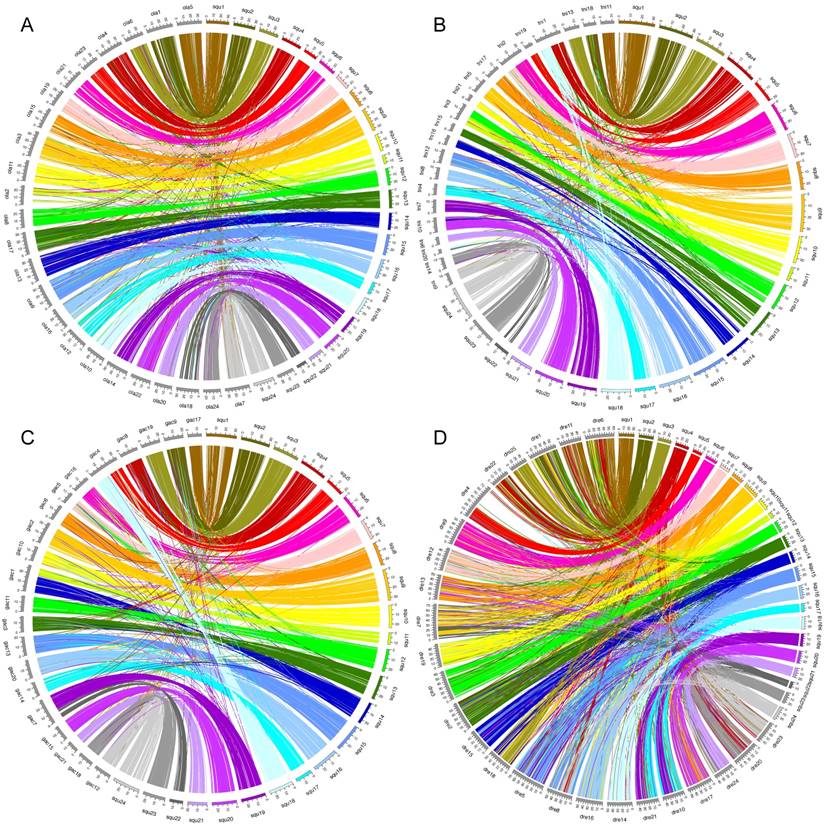
Circos plots showing conservation of synteny between A: yellowtail (right side, multicolored) and Japanese medaka (left side, grays); B: yellowtail (right side, multicolored) and spotted green pufferfish (left side, grays); C: yellowtail (right side, multicolored) and three-spined stickleback (left side, grays); D: yellowtail (right side, multicolored) and zebrafish (left side, grays).
Between yellowtail and spotted green pufferfish, 4581 of the orthologs were located in the 24 LGs of yellowtail and 21 chromosomes of pufferfish, and 90.0% of them were contained in conserved groups shown in an Oxford grid (Figure 2B). The chromosomes of these two species showed mostly one-to-one correspondence, but three pairs of two-to-one correspondence (Figure 3B).
Between yellowtail and three-spined stickleback, 6147 of the orthologs were located in the 24 LGs of yellowtail and 21 chromosomes of stickleback, and 95.2% of them contained conserved groups shown in an Oxford grid (Figure 2C). The chromosomes of these two species showed one-to-one correspondence, but three pairs of two-to-one correspondence (Figure 3C).
Between yellowtail and zebrafish, 6111 of the orthologs were located in the 24 LGs of yellowtail and 25 chromosomes of zebrafish. Some clusters consisting of a large number of orthologs were present in each of the chromosomes. Eight chromosomes in each species showed one-to-one correspondence, and three chromosomes showed a one-to-two relationship (Figure 2D, Figure 3D).
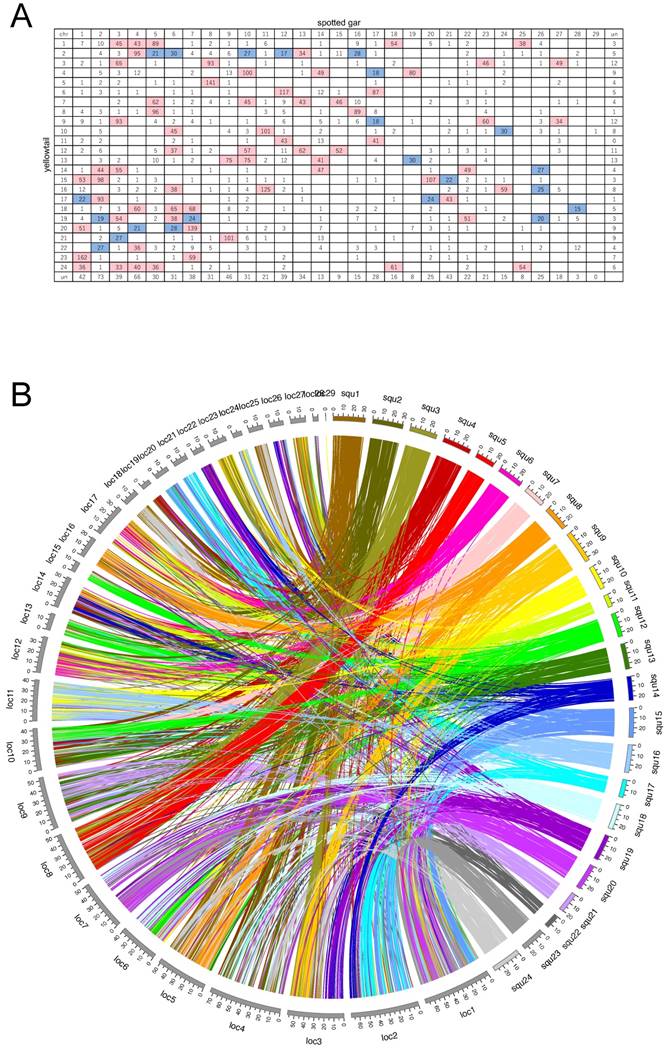
Between yellowtail and spotted gar, 5586 of the orthologs were located in the 24 LGs of yellowtail and 29 chromosomes of spotted gar. Some combinations of chromosomes in each species showed almost complete two-to-one correspondence, and others showed four-to-one (or more) correspondence (Figure 4).
A: Oxford grid showing conservation of synteny between yellowtail and spotted gar. Rows correspond to yellowtail linkage groups. Columns correspond to spotted-gar chromosomes. The number in each square indicates the number of orthologs. Rows and columns labelled 'un' indicate the number of unlocated orthologs. White squares indicate 0-14 orthologs, blue squares 15-30 orthologs, and pink squares >30 orthologs. B: Circos plot showing positional relations of orthologs between yellowtail (right side, multicolored) and spotted gar (left side, grays).
Spotted green pufferfish and three-spined stickleback each have 42 (2n) chromosomes, and yellowtail and medaka each have 48 (2n) chromosomes. Therefore, in comparisons between yellowtail and pufferfish or stickleback, there can be one-to-two correspondence. The chromosome combinations between pufferfish (Tni) and yellowtail (Squ) were: Tni1 - Squ4 / Squ18, Tni2 - Squ6 / Squ7, and Tni3 - Squ11 / Squ12 (Figure 2B). The combinations between stickleback (Gac) and yellowtail (Squ) were: Gac11 - Squ11 / Squ14, Gac4 - Squ5 / Squ18, and Gac7 - Squ19 / Squ22 (Figure 2C). These chromosomes of pufferfish and stickleback probably underwent Robertsonian translocations after the divergence of each lineage. However, almost all the syntenic relationships were conserved between yellowtail and pufferfish or stickleback as well as between yellowtail and medaka. These results suggested that the chromosome structures are well conserved in these fish species derived from a common ancestor.
Zebrafish are tropical freshwater fish of Indian origin, belonging to the subfamily Rasborinae in the order Cypriniformes. The zebrafish Danio rerio has 50 (2n) chromosomes. The chromosome combinations between zebrafish (Dre) and yellowtail (Squ) were: Dre5 - Squ15 / Squ17, Dre6 - Squ1 / Squ4, Dre7 - Squ9 / Seq22, Dre8 - Squ4 / Squ16 / Seq24, Dre10 - Squ17 / Squ19, Dre13 - Squ8 / Seq20, Dre18 - Squ3 / Squ9 / Squ14, Dre21 - Squ17 / Squ19, and Dre22 - Squ1 / Squ4 (Figure 2D). Yellowtail LG1, LG4, and LG17 contained parts of three zebrafish chromosomes, namely Dre6, Dre11, and Dre22, and many small parts of the zebrafish chromosomes were distributed in multiple yellowtail chromosomes. Clearly, the relationship of the chromosome structure between yellowtail and zebrafish is very complex. These results suggested that the process of chromosome evolution might be different between zebrafish and yellowtail under the different circumstances of a freshwater or marine environment. Fishes in freshwater environments are exposed to common topographic barriers, which would hamper the gene flow between populations. In contrast, in the marine environment, the occurrence of large populations, the absence of well-defined geographical barriers, and a large capacity for dispersal would contribute to the homogenization of populations [4,36].
Spotted gar is an ancient fish species, the lineage of which diverged from the teleost lineage before the teleost-specific WGD event occurred [24], and its lineage represents the unduplicated sister group of teleosts. Thus, we compared syntenic structures between yellowtail and spotted gar, and between spotted gar and four other acanthopterygian species. Many chromosome blocks were conserved between yellowtail and spotted gar, but some yellowtail chromosome blocks were distributed into some chromosomes of spotted gar. Spotted-gar chromosome (Loc) 11 corresponded to Squ10 and Squ16, Loc18 corresponded to Squ1 and Squ24, Loc23 corresponded to Squ3 and Squ9, Loc25 corresponded to Squ1 and Squ24, and Loc27 corresponded to Squ3 and Squ9. These spotted-gar chromosomes showed an overall one-to-two double-conserved syntenic relationship with the yellowtail chromosomes. The other spotted-gar chromosomes corresponded to several yellowtail chromosomes. These data demonstrate the overall one-to-two double-conserved syntenic relationship of spotted gar to a post-teleost WGD.
We constructed a high-density physical map with 13,977 ESTs and accurately compared yellowtail chromosome rearrangements with four other fish species using syntenic relationships. We used the publicly available spotted-gar genome information as the outgroup to infer the genome evolution of teleosts. The regions that had different syntenic relationships with spotted gar were considered the regions that had undergone chromosomal rearrangements.
The common ancestor from which these four species diverged is likely to have had 48 chromosomes, because most extant acanthopterygian species have 48 chromosomes, and three of the chromosomes in the species that have 42 chromosomes (i.e., spotted green pufferfish and three-spined stickleback) contain combinations of two entire chromosomes in different patterns. The inferred distribution of ancestral chromosomes in yellowtail, medaka, spotted green pufferfish, and three-spined stickleback is shown in Figure 5.
Predicted chromosomal rearrangements of four acanthopterygian species. The 24 putative ancestral chromosomes are represented by the colored bars on the left side; the distribution of the ancestral chromosome segments in the four species is shown on the right side.
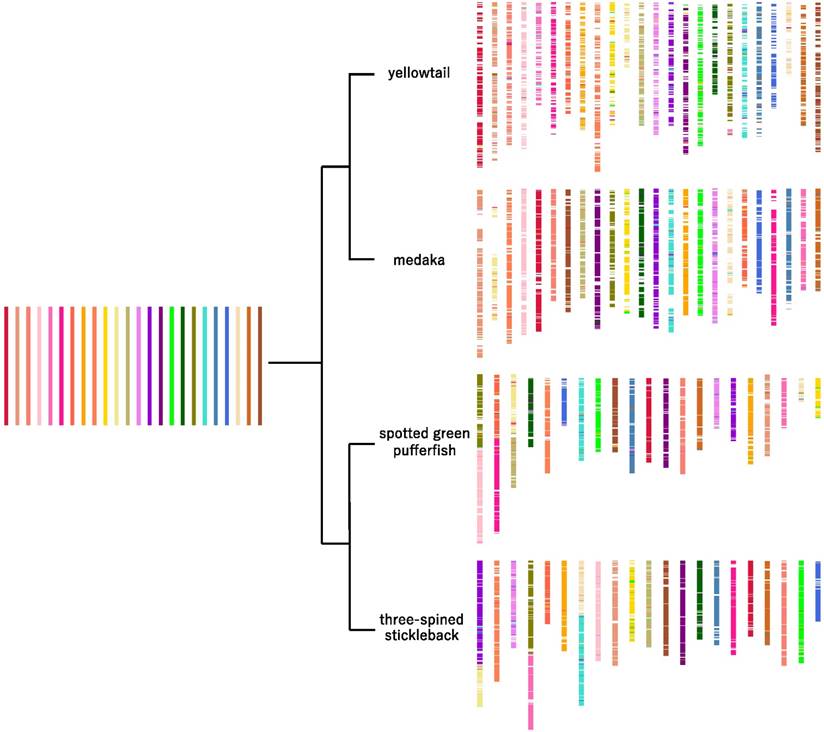
In the four species studied, the translocations were distributed widely on each chromosome (Figure 5). Therefore, we consider that, in the past, illegitimate recombinations may have occurred randomly in entire chromosome regions in each lineage, and that some of them were inherited by extant species.
The number of inter-chromosomal translocations in yellowtail was 1.5-2-times higher than those in medaka, pufferfish, and stickleback (Table 3), which had similar numbers of inter-chromosomal translocations (Table 3).
Summary of inter-chromosomal translocations in four Acanthopterygii species (LG = linkage group)
| gar LG | yellowtail | medaka | yellowtail | pufferfish | yellowtail | stickleback | medaka | pufferfish | medaka | stickleback | pufferfish | stickleback | |||||
|---|---|---|---|---|---|---|---|---|---|---|---|---|---|---|---|---|---|
| 1 | 10 | 5 | 10 | 4 | 12 | 8 | 13 | 13 | 19 | 10 | 13 | 7 | |||||
| 2 | 15 | 7 | 14 | 5 | 19 | 6 | 11 | 12 | 17 | 5 | 15 | 5 | |||||
| 3 | 21 | 14 | 19 | 10 | 15 | 7 | 16 | 19 | 18 | 17 | 15 | 16 | |||||
| 4 | 16 | 11 | 10 | 7 | 16 | 7 | 12 | 4 | 17 | 7 | 11 | 12 | |||||
| 5 | 7 | 13 | 9 | 9 | 12 | 5 | 8 | 14 | 16 | 8 | 11 | 5 | |||||
| 6 | 3 | 5 | 7 | 7 | 5 | 9 | 8 | 12 | 7 | 21 | 12 | 11 | |||||
| 7 | 10 | 6 | 14 | 8 | 18 | 5 | 11 | 9 | 14 | 19 | 10 | 11 | |||||
| 8 | 5 | 7 | 9 | 5 | 10 | 4 | 17 | 13 | 16 | 7 | 15 | 14 | |||||
| 9 | 2 | 7 | 5 | 3 | 12 | 3 | 10 | 8 | 14 | 15 | 7 | 5 | |||||
| 10 | 4 | 23 | 14 | 7 | 1 | 22 | 11 | 14 | 9 | 19 | 13 | 13 | |||||
| 11 | 8 | 4 | 3 | 3 | 9 | 3 | 5 | 13 | 13 | 7 | 11 | 0 | |||||
| 12 | 5 | 10 | 5 | 9 | 5 | 11 | 5 | 6 | 14 | 10 | 10 | 7 | |||||
| 13 | 8 | 3 | 4 | 4 | 8 | 4 | 3 | 9 | 2 | 7 | 8 | 6 | |||||
| 14 | 10 | 3 | 8 | 4 | 6 | 3 | 7 | 10 | 8 | 9 | 4 | 2 | |||||
| 15 | 1 | 4 | 1 | 3 | 2 | 3 | 5 | 2 | 1 | 2 | 1 | 6 | |||||
| 16 | 8 | 1 | 5 | 2 | 7 | 8 | 3 | 7 | 7 | 11 | 8 | 8 | |||||
| 17 | 7 | 4 | 11 | 5 | 8 | 5 | 8 | 8 | 7 | 11 | 9 | 9 | |||||
| 18 | 5 | 4 | 2 | 0 | 8 | 3 | 4 | 4 | 3 | 3 | 3 | 1 | |||||
| 19 | 8 | 5 | 5 | 5 | 7 | 7 | 4 | 6 | 2 | 9 | 5 | 5 | |||||
| 20 | 10 | 4 | 7 | 4 | 10 | 2 | 6 | 7 | 3 | 5 | 7 | 6 | |||||
| 21 | 2 | 1 | 1 | 0 | 3 | 1 | 4 | 2 | 4 | 6 | 0 | 2 | |||||
| 22 | 10 | 2 | 10 | 4 | 9 | 1 | 4 | 11 | 6 | 7 | 11 | 9 | |||||
| 23 | 5 | 2 | 2 | 0 | 5 | 2 | 3 | 0 | 6 | 3 | 1 | 2 | |||||
| 24 | 7 | 1 | 2 | 0 | 8 | 2 | 2 | 1 | 0 | 4 | 2 | 3 | |||||
| 25 | 1 | 3 | 1 | 1 | 2 | 1 | 1 | 0 | 2 | 4 | 1 | 3 | |||||
| 26 | 2 | 0 | 3 | 0 | 2 | 0 | 3 | 3 | 7 | 1 | 4 | 2 | |||||
| 27 | 6 | 2 | 6 | 4 | 5 | 3 | 4 | 3 | 6 | 3 | 5 | 5 | |||||
| 28 | 0 | 1 | 0 | 0 | 1 | 0 | 1 | 0 | 0 | 0 | 0 | 1 | |||||
| 29 | 0 | 0 | 0 | 0 | 0 | 0 | 0 | 0 | 0 | 0 | 0 | 0 | |||||
| Total | 192 | 94 | 159 | 97 | 202 | 111 | 189 | 210 | 238 | 230 | 212 | 176 |
The difference of chromosome structural variation, such as intra- and inter-chromosomal translocation, and genetic diversity between yellowtail and the other species may be caused by striking differences in the habitat, population size, and/or life history of yellowtail [37,38]. Alternatively, genetic drift may have affected the yellowtail lineage more strongly than the other lineages since yellowtail is widely distributed in the marine environment as compared with the other species.
Conclusions
We constructed a high-density yellowtail (Seriola quinqueradiata) radiation hybrid (RH) physical map with 1,713 DNA markers, and anchored the genome sequences onto the RH physical map. We finally mapped a total of 13,977 ESTs on a genome sequence assembly aligned with the physical map. Using this high-density physical map and the anchored genome sequences, we accurately compared the yellowtail genome structure with the genome structures of five model fishes. Between yellowtail and Japanese medaka Oryzias latipes, almost all regions of the chromosomes were conserved and some blocks comprising several markers were translocated. Using the genome information of the spotted gar Lepisosteus oculatus (a non-teleost) as a reference, we further documented the syntenic relationships and chromosomal rearrangements that occurred during evolution in four other acanthopterygian species. The evolutionary chromosome translocation frequency was 1.5-2-times higher in yellowtail than in Japanese medaka, spotted green pufferfish Tetraodon nigroviridis, or three-spined stickleback Gasterosteus aculeatus.
Acknowledgements
This work was supported by a grant from the National Research Institute of Aquaculture, Japan. We especially thank Junko Tabata for her technical support. We thank Edanz Group (www.edanzediting.com/ac) for editing a draft of this manuscript.
Data Accessibility
The experiment data files are available at Mendeley Data (https://data.mendeley.com/datasets/dwbwg9szym/1).
Competing Interests
The authors have declared that no competing interest exists.
References
1. Nelson JS, Grande TC, Wilson MV. Fishes of the World. Hoboken, New Jersey: John Wiley and Sons, Inc. 2016
2. May RM, Godfrey J. Biological diversity: differences between land and sea [and Discussion]. Philos Trans R Soc B Biol Sci. 1994;343(1303):105-111
3. Vermeij GJ, Grosberg RK. The great divergence: when did diversity on land exceed that in the sea? Integr Comp Biol. 2010;50(4):675-682
4. Carrete Vega G, Wiens JJ. Why are there so few fish in the sea? Proc R Soc B Biol Sci. 2012;279(1737):2323-2329
5. Ohno S. Evolution by Gene Duplication. Berlin, Heidelberg: Springer Berlin Heidelberg. 1970
6. Christoffels A, Koh EGL, Chia JM, Brenner S, Aparicio S, Venkatesh B. Fugu genome analysis provides evidence for a whole-genome duplication early during the evolution of ray-finned fishes. Mol Biol Evol. 2004;21(6):1146-1151
7. Hoegg S, Brinkmann H, Taylor JS, Meyer A. Phylogenetic timing of the fish-specific genome duplication correlates with the diversification of teleost fish. J Mol Evol. 2004;59(2):190-203
8. Vandepoele K, De Vos W, Taylor JS, Meyer A, Van de Peer Y. Major events in the genome evolution of vertebrates: Paranome age and size differ considerably between ray-finned fishes and land vertebrates. Proc Natl Acad Sci. 2004;101(6):1638-1643
9. Hurley IA, Mueller RL, Dunn KA. et al. A new time-scale for ray-finned fish evolution. Proc R Soc B Biol Sci. 2007;274(1609):489-498
10. Braasch I, Postlethwait JH. Polyploidy in Fish and the Teleost Genome Duplication. In: (ed.) Soltis PS, Soltis DE. Polyploidy and Genome Evolution. Berlin, Heidelberg: Springer Berlin Heidelberg. 2012:341-383
11. Berthelot C, Brunet F, Chalopin D. et al. The rainbow trout genome provides novel insights into evolution after whole-genome duplication in vertebrates. Nat Commun. 2014;5:3657
12. Jaillon O, Aury J-M, Brunet F. et al. Genome duplication in the teleost fish Tetraodon nigroviridis reveals the early vertebrate proto-karyotype. Nature. 2004;431(7011):946-957
13. Kasahara M, Naruse K, Sasaki S. et al. The medaka draft genome and insights into vertebrate genome evolution. Nature. 2007;447(7145):714-719
14. Jones FC, Grabherr MG, Chan YF. et al. The genomic basis of adaptive evolution in threespine sticklebacks. Nature. 2012;484(7392):55-61
15. Howe K, Clark MD, Torroja CF. et al. The zebrafish reference genome sequence and its relationship to the human genome. Nature. 2013;496(7446):498-503
16. Lien S, Koop BF, Sandve SR. et al. The Atlantic salmon genome provides insights into rediploidization. Nature. 2016;533(7602):200-205
17. Xu P, Zhang X, Wang X. et al. Genome sequence and genetic diversity of the common carp, Cyprinus carpio. Nat Genet. 2014;46(11):1212-1219
18. Zhao L, Zhang Y, Ji P. et al. A dense genetic linkage map for common carp and its integration with a BAC-based physical map. PLoS One. 2013;8(5):e63928
19. National Center for Biotechnology Information. Genome - NCBI. https://www.ncbi.nlm.nih.gov/genome
20. Braasch I, Peterson SM, Desvignes T, McCluskey BM, Batzel P, Postlethwait JH. A new model army: Emerging fish models to study the genomics of vertebrate Evo-Devo. J Exp Zool Part B Mol Dev Evol. 2015;324(4):316-341
21. Aoki J, Kai W, Kawabata Y. et al. Construction of a radiation hybrid panel and the first yellowtail (Seriola quinqueradiata) radiation hybrid map using a nanofluidic dynamic array. BMC Genomics. 2014;15(1):165
22. Fuji K, Koyama T, Kai W. et al. Construction of a high-coverage bacterial artificial chromosome library and comprehensive genetic linkage map of yellowtail Seriola quinqueradiata. BMC Res Notes. 2014;7(1):200
23. Braasch I, Gehrke AR, Smith JJ. et al. The spotted gar genome illuminates vertebrate evolution and facilitates human-teleost comparisons. Nat Genet. 2016;48(4):427-437
24. Amores A, Catchen J, Ferrara A, Fontenot Q, Postlethwait JH. Genome Evolution and Meiotic Maps by Massively Parallel DNA Sequencing: Spotted Gar, an Outgroup for the Teleost Genome Duplication. Genetics. 2011;188(4):799-808
25. Untergasser A, Cutcutache I, Koressaar T. et al. Primer3-new capabilities and interfaces. Nucleic Acids Res. 2012;40(15):e115
26. de Givry S, Bouchez M, Chabrier P, Milan D, Schiex T. CARHTA GENE: multipopulation integrated genetic and radiation hybrid mapping. Bioinformatics. 2005;21(8):1703-1704
27. Aoki J, Kai W, Kawabata Y. et al. Second generation physical and linkage maps of yellowtail (Seriola quinqueradiata) and comparison of synteny with four model fish. BMC Genomics. 2015;16(1):406
28. Yates A, Akanni W, Amode MR. et al. Ensembl 2016. Nucleic Acids Res. 2016;44(D1):D710-D716
29. EDWARDS JH. The Oxford Grid. Ann Hum Genet. 1991;55(1):17-31
30. Krzywinski M, Schein J, Birol I. et al. Circos: An information aesthetic for comparative genomics. Genome Res. 2009;19(9):1639-1645
31. Kawase J. Experiment data files for: Constructing a “chromonome” of yellowtail (Seriola quinqueradiata) for comparative analysis of chromosomal rearrangements. https://data.mendeley.com/datasets/dwbwg9szym/1
32. Sarropoulou E, Franch R, Louro B. et al. A gene-based radiation hybrid map of the gilthead sea bream Sparus aurata refines and exploits conserved synteny with Tetraodon nigroviridis. BMC Genomics. 2007;8(1):44
33. Guyon R, Senger F, Rakotomanga M. et al. A radiation hybrid map of the European sea bass (Dicentrarchus labrax) based on 1581 markers: Synteny analysis with model fish genomes. Genomics. 2010;96(4):228-238
34. Guyon R, Rakotomanga M, Azzouzi N. et al. A high-resolution map of the Nile tilapia genome: a resource for studying cichlids and other percomorphs. BMC Genomics. 2012;13(1):222
35. Betancur-r R, Broughton RE, Wiley EO. et al. The tree of life and a new classification of bony fishes. PLOS Curr Tree Life. 2013:732988 1-45
36. Nirchio M, Rossi AR, Foresti F, Oliveira C. Chromosome evolution in fishes: A new challenging proposal from Neotropical species. Neotrop Ichthyol. 2014;12(4):761-770
37. Fan S, Meyer A. Evolution of genomic structural variation and genomic architecture in the adaptive radiations of African cichlid fishes. Front Genet. 2014;5(JUN):1-9
38. Chain FJJ, Feulner PGD. Ecological and evolutionary implications of genomic structural variations. Front Genet. 2014;5(SEP):326
Author contact
![]() Corresponding author: Graduate School of Bioresources, Mie University, 1577 Kurimamachiya-cho, Tsu city, Mie Prefecture 514-8507, Japan; tel.: +81 59-231-9626, ext. 2531; fax: +81 59-231-9634. E-mail: 515d303mie-u.ac.jp (J. Kawase).
Corresponding author: Graduate School of Bioresources, Mie University, 1577 Kurimamachiya-cho, Tsu city, Mie Prefecture 514-8507, Japan; tel.: +81 59-231-9626, ext. 2531; fax: +81 59-231-9634. E-mail: 515d303mie-u.ac.jp (J. Kawase).