ISSN: 1839-9940

 Global reach, higher impact
J Genomics 2015; 3:29-35. doi:10.7150/jgen.10888 This volume Cite
Research Paper
Database of Gene Co-Regulation (dGCR): A Web Tool for Analysing Patterns of Gene Co-regulation across Publicly Available Expression Data
Gareth Williams ![]()
Wolfson Centre for Age-Related Diseases, King's College London, London Bridge, London SE1 1UL, UK.
Published 2015-1-15
Abstract
The database of Gene Co-Regulation (dGCR) is a web tool for the analysis of gene relationships based on correlated patterns of gene expression over publicly available transcriptional data. The motivation behind dGCR is that genes whose expression patterns correlate across many experiments tend to be co-regulated and hence share biological function. In addition to revealing functional connections between individual gene pairs, extended sets of co-regulated genes can also be assessed for enrichment of gene ontology classes and interaction pathways. This functionality provides an insight into the biological function of the query gene itself. The dGCR web tool extends the range of expression data curated by existing co-regulation databases and provides additional insights into gene function through the analysis of pathways, gene ontology classes and co-regulation modules.
Keywords: Global gene expression, connectivity map, microarray.
Introduction
Global gene expression serves as a quantitative high content descriptor of biological states. This together with the vast amount of publicly available data [1, 2] provides an ideal basis for comparing biological perturbations through their associated transcriptional profiles across a wide range of experiments. The approach has been successfully applied in the area of drug repositioning with the connectivity map (CMAP) initiative [3, 4] and has led to the development of transcription based search engines such as GEM-TREND [5], ProfileChaser [6], Gene Expression Atlas [7] and SPIED [8, 9], that have thrown up intriguing connections between diverse biological systems. These methodologies are not driven by gene discovery and the pinpointing of a single gene underlying a given pathology, for example. Rather, the transcriptomes are compared globally, with the regulation of individual genes not making a profound contribution to the correlation. However, expression data can be a useful tool in assigning shared biological function to a pair of genes that show correlated expression changes over a relatively large dataset. In other words, robust patterns of co-expression can inform co-regulation and therefore function. Currently, there are many gene analysis portals based around correlated gene expression patterns. The Human Gene Co-expression [10] web tool taps into the gene expression variation within a set of immortalised human cell lines with varied genotypes to define patterns of co-expression for over 4,000 genes. Whereas, Gene friends [11] provides co-expression patterns based on over 1,000 murine arrays. CoXpresDB [12] has extended the analysis to include data from a variety of species in an effort to increase the robustness of gene pair co-regulation through conservation across species. The data underlying this analysis is from a relatively large set of arrays, ~10,000, and from 11 species. BIOGPS [13] is a gene annotation and analysis portal with links to expression data over human, mouse and rat arrays corresponding to various tissue types. These expression patterns are compared to define ranked lists of correlating genes. The neuroblast application of Allen Brain Atlas [14] uses in situ data from multiple well defined mouse brain and spinal cord regions to define gene expression patterns and compare these to inform shared function.
The essentially automated compilation of transcriptional data into the unified searchable platform SPIED allowed for the quantitative comparison of query expression profiles against a theoretically unlimited amount of deposited transcriptional data. The data underlying SPIED is effectively a large matrix over experimental conditions and genes. Furthermore, the matrix can be thought of as a series of expression patterns for the genes, extending to over 200,000 conditions, and these can be correlated resulting in a gene co-regulation matrix. The dGCR web tool presented here was designed to interrogate this matrix. In particular, dGCR is based on the analysis of the most regulated genes across the database facilitating a simple binary statistic fisher test measure of the correlation in gene expression patterns. Thus, gene co-regulation can be defined over a vast collection of diverse experimental conditions and the robustness assessed over blocks of data corresponding to species type and platform technology.
The details underlying the construction of dGCR are given in the Methods section. In the Results sections the use of dGCR is illustrated with examples and an analysis of the global picture of gene co-regulation presented. Specifically, a detailed analysis of the co-regulation matrix shows a significant overlap between the different platforms and hence a high degree of internal consistency. It is further shown that protein/gene interaction networks, gene ontology classes and pathway gene sets are significantly enriched for co-regulated genes. Finally, hierarchical clustering derived gene modules, demarcating distinct functional networks, are derived from the co-regulation matrix.
Results
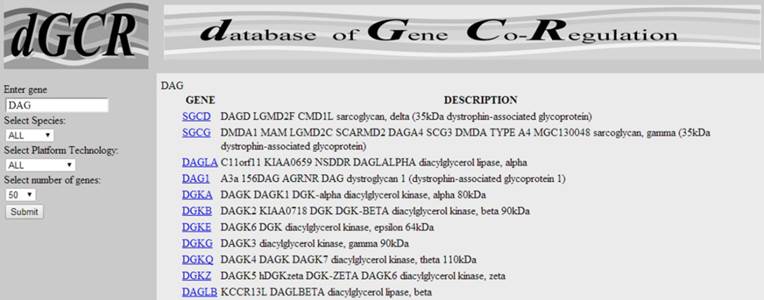
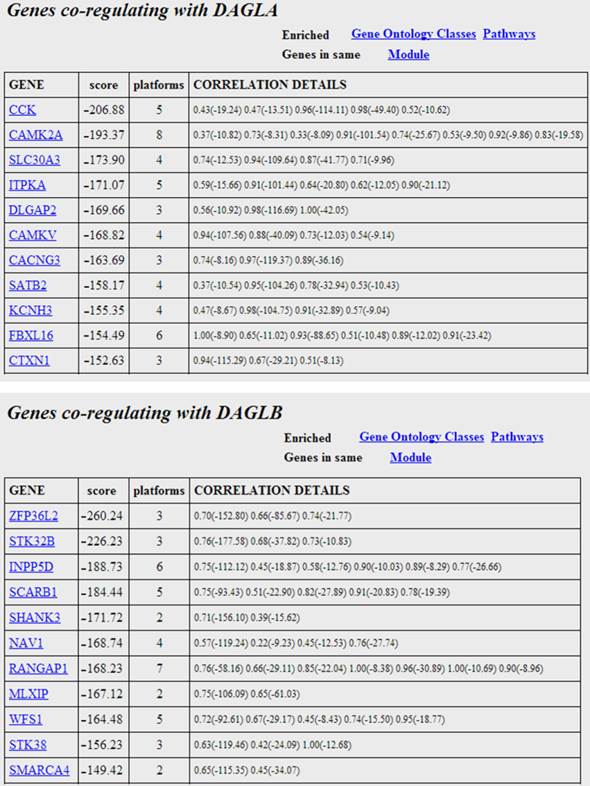
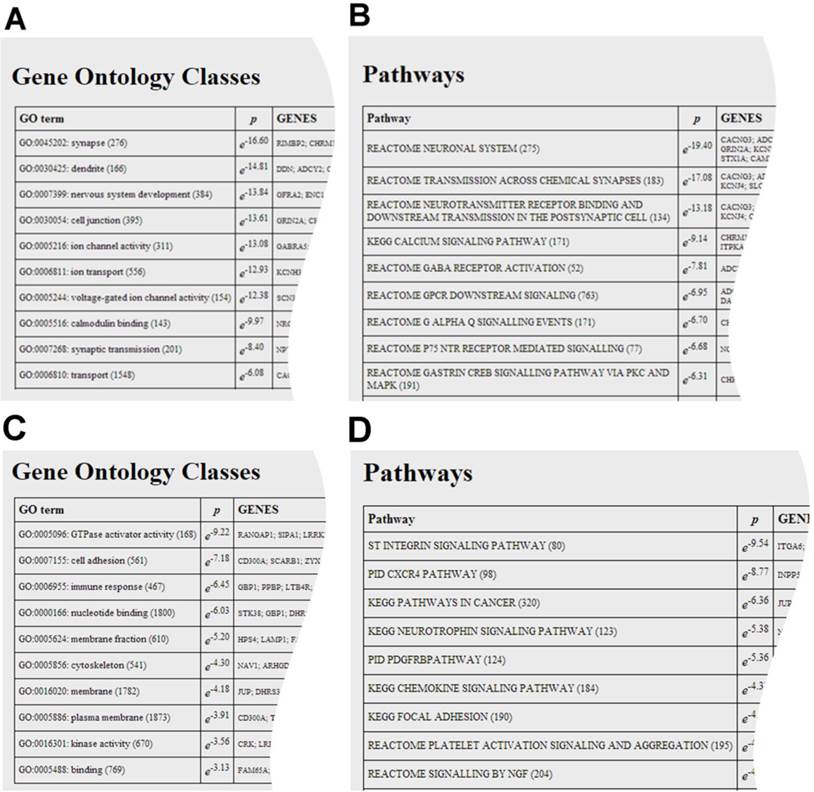
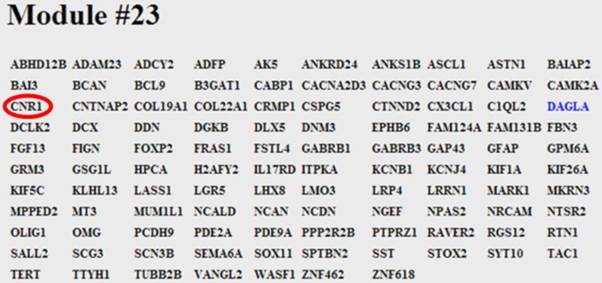
The user inputs a gene name and then selects the required gene symbol from a candidate list of possible alternatives, see Figure 1. The number of top scoring co-regulating genes to be displayed can be extended from the default of 50. Also, co-regulation can be restricted to be measured over specific species or platform technologies. Once the chosen gene is selected the output lists the top co-regulated genes together with details of the platforms where co-regulation is significant, see Figure 2. Web links enable the user to query literature on the given genes. The gene list as a whole is usually enriched for informative gene ontology (GO) classes and pathways. With this in mind the output page hosts buttons that link to enriched GO and pathway classes that can reveal functional aspects of the query gene, see Figure 3. The example gene queries correspond to the two isoforms of DAG lipase, DAGLA and DAGLB. These enzymes have diverse functions, being implicated in neuronal development, adult neurogenesis, synaptic retrograde signalling and immune responses [15]. It is of interest to see to what extent gene co-regulation can throw light on the different functions of the two isoforms. From GO and pathway analysis it is clear that the α isoform is involved in synaptic function whereas the β isoform is involved in the immune response, see Figure 3. Here, dGCR was queried across the whole database, without restrictions on species or platform type. The synaptic role of DAGLA has long been established [16] and the role of DAGLB in the immune response has recently emerged [17]. A further analysis consists in placing the query gene in a module defined through hierarchical clustering, see Methods. Here novel connections can emerge where two genes are weakly correlated ( , see Methods), but belong to the same module by virtue of shared co-regulated genes. In the present query case, DAGLA belongs to a module of 107 genes and the receptor for its hydrolysis product, 2-AG, the cannabinoid receptor (CB1, CNR1), is in the same module [16].
The dGCR web page screen shot with query 'DAG'. The possible genes are listed with links for further analysis. At left the user selects the number of co-regulating genes (50-500) and may restrict the analysis to a given species. The two genes that will be analysed here are the two isoforms of DAG lipase, DAGLα (DAGLA) and DAGLβ (DAGLB).
The genes most co-regulated with the two isoforms of DAG lipase. The scores are the sums of the fisher log-odds scores for each platform. Each gene entry is hyperlinked to explanatory web material. The correlation values and significance scores (in brackets) are given for the individual platforms in the right column. Moving the mouse over the individual scores reveals the platform where the correlation obtains.
The user can analyse the co-regulated gene set for the enrichment of gene ontology classes, shown in A and C, and pathways, shown in B and D. Both analyses point to a synaptic function for DAGLα and immunological function for DAGLβ.
Screen shot of module #23. The module consists of 107 genes and DAGLα is shown highlighted in blue. The module links the post-synaptic 2-AG synthesising enzyme, DAGLα, to the pre-synaptic 2-AG receptor, the cannabinoid receptor (CB1, CNR1), circled in red.
A global analysis
The gene expression samples making up dGCR come from 26 array platforms, corresponding to Affymetrix (www.affymetrix.com), Illumina (www.illumina.com) and Agilent (www.agilent.co.uk) technologies and with probes specific to human, mouse and rodent material. One of the reasons for the effectiveness of dGCR is that patterns of gene co-regulation are highly conserved across these platforms. This is quantified in the Supplementary Material: Table S1, detailing the number of genes present for each platform, the number of co-regulated pairs (defined by a stringent significance threshold of the Fisher exact test,  ) and the number of these shared between the platforms. For example, comparing the human array GPL96 with the mouse array GPL1261, there are 9,963 common genes with 165,240 and 130,005 co-regulated pairs respectively and 26,424 of these are shared.
Pathways and Gene Ontology classes
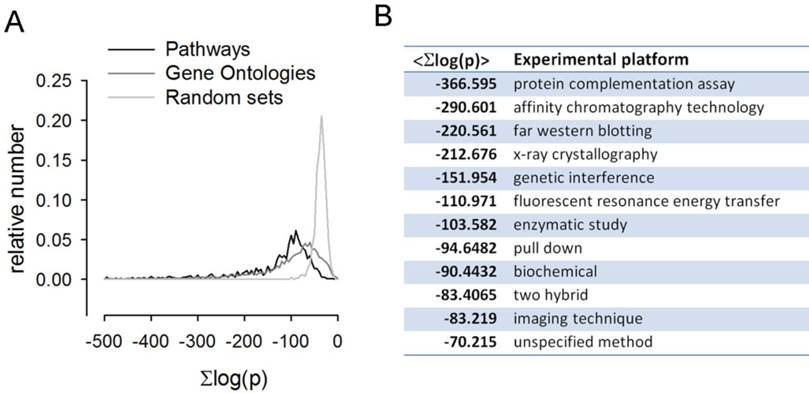
A complementary global analysis consists of directly scoring pathway sets for the mutual co-regulation of the genes. This analysis is relevant to transcriptional data analysis in general as pathway [18] and GO set enrichment [19] are ubiquitously applied in the field. To this end we scored all pairs of genes within a given pathway for their co-regulation across the full platform set. On average the intra-pathway co-regulation scores are highly significant. Explicitly, all pairs of genes within the given pathway pair are assigned correlation scores corresponding to the summed log Fisher scores across all the array platforms and the average over all pairs is highly significant, with 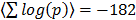 . The distribution of co-regulation scores is compared to that of a random collection of gene sets in Figure 5A. GO classes are defined through shared molecular function, biological process and cellular location. There is thus an obvious basis for genes in the same class to be co-regulated. To quantify this we scored the available GO sets for co-regulation against the dGCR database in a similar way to that of the pathway analysis already described. Again the average intra-pathway co-regulation score is highly significant (
 ). The distribution of co-regulation scores is compared to that of a random collection of gene sets in Figure 5A.
Pathways, GO sets and interacting proteins were scored for mutual co-regulation. The summed log-odds co-regulation scores across the array platforms for each gene pair in a given pathway and GO set were compiled and the distributions plotted in A. It is clear that for both pathway sets and gene ontology sets the distributions are significantly shifted towards high scores relative to the random gene sets distribution. The co-regulation score averages across the protein interacting pairs from the 12 distinct experimental platforms in the BioGrid database are shown in the table B.
Protein and gene interaction networks
It is interesting to compare co-regulation with biological interaction at the protein level as there is an obvious basis for interacting proteins to be correlated in their expression patterns. BioGRID [20] hosts a comprehensive dataset of protein interaction data. Interactions fall into many categories and varying degrees of certainty. Taking each category in turn we collected the co-regulation scores for the genes corresponding to the given protein pairs and found that these are shifted towards high significance relative to random pairs. See Figure 5B.
Discussion and Conclusions
Patterns of gene co-regulation can offer an insight into shared biological function. In contrast to pathway and gene ontology sets, co-regulation is established purely quantitatively, based on multiple gene expression studies across different species and cell/tissue types. The dGCR web tool presented here is a simple to use interface for accessing patterns of co-regulation and should enable users to uncover novel relationships between query genes and offer novel insights into the underlying biology. The database constitutes a complimentary analysis to that of SPIED, which is queried with expression profile data and offers a quantitative comparison of biological perturbations across multiple experiments. Whereas, dGCR is based on a re-working of the same expression data so that comparisons of genes are scored across samples as opposed to comparisons of samples being scored across genes. The idea that co-regulation informs function underlies the many gene analysis portals detailed in the introduction. The novelty with dGCR is to extend the methodology to include at present a quarter of publicly available transcriptional data for human and rodent species. The data processing underlying dGCR is automatic, based on a simple normalisation procedure, and it is hoped to extend the database beyond the current 200,000 samples and include other species.
Methods
dGCR is based on the expression data collected in SPIED [8, 9], compiled from the data hosted by NCBI GEO (www.ncbi.nlm.nih.gov/geo), consisting of over 200,000 array samples covering Affymetrix, Agilent and Illumina platform technologies and human, mouse and rat material. Here, expression data was converted to fold profiles defined relative to the probe average across the sample series. The probe profiles were then mapped to profiles defined in terms of non-redundant gene sets. For genes with multiple probes the gene level was assigned the level of the probe with greatest fold magnitude. SPIED was populated with gene lists ranked according to fold magnitude. In addition to the full database an abridged database consisting of the top 1000 regulated genes (500 up and 500 down regulated) was also created for rapid querying and for gene set enrichment analysis. This latter database facilitated a simple expression pattern comparison between genes, where the up/down status of a given pair could be followed over an extensive set of samples and the extent of co-regulation determined. This database served as the basis for dGCR. Specifically, for a given pair of genes that are both regulated over a set of samples corresponding to independent transcription profile experiments, the correlation was given by 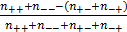 , where n are the sample numbers and the +/- indices refer to the gene's up/down status. The significance was measured by an exact Fisher test.
Querying dGCR returns a list of genes ranked based on the summed log-odds correlation scores,  , across either the full set of platforms, in the default mode, or the platforms corresponding to the given choice of species or technology. The output also lists the measure of correlation and the corresponding significance for the individual platforms.
The dGCR database consists of gene pair co-regulation data for separate platforms. The internal consistency of the co-regulation matrices derived from multiple platforms was addressed with a simple enrichment analysis scoring the likelihood of shared gene pairs in the top slice of co-regulation significance. There is a high degree of overlap between the platforms forming the database. Details of the overlap between the top scoring gene pair sets corresponding to the different platforms are shown in Supplementary Material: Table S1.
Gene cluster modules were generated by first selecting co-regulated gene pairs with summed significance scores across the platforms of below -100, with the co-regulation being significant in at least 5 platforms. This resulted in 14,535 genes with 3.1x10⁶ co-regulation associations i.e. a network with 14,535 nodes and 3.1x10⁶ edges. Gene pairs were then ranked based on the similarity of the respective edges, measured by a Tanimoto score. Specifically, the similarity score is
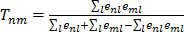 , where n, m, l are the nodes and the edges are
  . If edges have the same score then the one with nodes having the most edges is ranked higher. The clustering proceeds by seeding the first cluster with the highest ranked edge. The next edge is added to this cluster if there is a shared node otherwise a new cluster is seeded with this edge. If an edge connects two clusters then these clusters are merged. That is, clusters are defined hierarchically. This results in all genes eventually ending up in the same cluster. However, by restricting the merger of clusters each gene can be assigned to a distinct module and genes with otherwise weak connections may be assigned function by virtue of their association with a module. One way of doing this is to ignore edges linking clusters above a given threshold size. When clusters with more than 10 nodes are not merged 470 distinct modules emerge, ranging in size from 202 to 2 genes. These modules are given in the Supplementary Material: Table S2. The dGCR output page has a link to the module to which the query belongs.
Gene set enrichment is measured by the likelihood relative to random mixing with a fisher test. The GO terms used were populated with genes from all evidence categories and taken from the three headings: biological process, cellular component or molecular function. The pathway gene sets correspond to the MsigDB canonical pathway sets and number 1,320 (www.broadinstitute.org/gsea/msigdb/collections.jsp) [21]. The gene ontology sets are from the gene ontology project hosted at www.geneontology.org [22]. These consist of 9335 GO term sets.
Supplementary Material
Table S1: The overlap between co-regulation matrices from the various platforms used for the dGCR database. Table S2: Gene lists for the 470 modules based on restricted hierarchical clustering.
Acknowledgements
This work was supported by the Wolfson CARD. I would like to thank Ramin Raouf for help in setting up the web tool.
Availability of dGCR
dGCR is available at www.dGCR.org.
Authors' contributions
GW is the sole author of the present study.
Competing Interests
The authors have declared that no competing interest exists.
References
1. Barrett T, Troup DB, Wilhite SE, Ledoux P, Rudnev D, Evangelista C. et al. NCBI GEO: mining tens of millions of expression profiles--database and tools update. Nucleic Acids Res. 2007;35:D760-5
2. Parkinson H, Sarkans U, Kolesnikov N, Abeygunawardena N, Burdett T, Dylag M. et al. ArrayExpress update--an archive of microarray and high-throughput sequencing-based functional genomics experiments. Nucleic Acids Res. 2011;39:D1002-4
3. Lamb J, Crawford ED, Peck D, Modell JW, Blat IC, Wrobel MJ. et al. The Connectivity Map: using gene-expression signatures to connect small molecules, genes, and disease. Science. 2006;313:1929-35
4. Wei G, Twomey D, Lamb J, Schlis K, Agarwal J, Stam RW. et al. Gene expression-based chemical genomics identifies rapamycin as a modulator of MCL1 and glucocorticoid resistance. Cancer Cell. 2006;10:331-42
5. Feng C, Araki M, Kunimoto R, Tamon A, Makiguchi H, Niijima S. et al. GEM-TREND: a web tool for gene expression data mining toward relevant network discovery. BMC Genomics. 2009;10:411
6. Engreitz JM, Chen R, Morgan AA, Dudley JT, Mallelwar R, Butte AJ. ProfileChaser: searching microarray repositories based on genome-wide patterns of differential expression. Bioinformatics. 27: 3317-8.
7. Kapushesky M, Adamusiak T, Burdett T, Culhane A, Farne A, Filippov A. et al. Gene Expression Atlas update--a value-added database of microarray and sequencing-based functional genomics experiments. Nucleic Acids Res. 2012;40:D1077-81
8. Williams G. A searchable cross-platform gene expression database reveals connections between drug treatments and disease. BMC Genomics. 2012;13:12
9. Williams G. SPIEDw: a searchable platform-independent expression database web tool. BMC Genomics. 2013;14:765. doi:10.1186/1471-2164-14-765
10. Nayak RR, Kearns M, Spielman RS, Cheung VG. Coexpression network based on natural variation in human gene expression reveals gene interactions and functions. Genome research. 2009;19:1953-62 doi:DOI 10.1101/gr.097600.109
11. van Dam S, Cordeiro R, Craig T, van Dam J, Wood SH, de Magalhaes JP. GeneFriends: an online co-expression analysis tool to identify novel gene targets for aging and complex diseases. BMC Genomics. 2012;13:535. doi:10.1186/1471-2164-13-535
12. Obayashi T, Okamura Y, Ito S, Tadaka S, Motoike IN, Kinoshita K. COXPRESdb: a database of comparative gene coexpression networks of eleven species for mammals. Nucleic Acids Res. 2013;41:D1014-20 doi:10.1093/nar/gks1014
13. Wu C, Orozco C, Boyer J, Leglise M, Goodale J, Batalov S. et al. BioGPS: an extensible and customizable portal for querying and organizing gene annotation resources. Genome Biol. 2009;10:R130
14. Lein ES, Hawrylycz MJ, Ao N, Ayres M, Bensinger A, Bernard A. et al. Genome-wide atlas of gene expression in the adult mouse brain. Nature. 2007;445:168-76 doi:10.1038/nature05453
15. Reisenberg M, Singh PK, Williams G, Doherty P. The diacylglycerol lipases: structure, regulation and roles in and beyond endocannabinoid signalling. Philosophical transactions of the Royal Society of London Series B, Biological sciences. 2012;367:3264-75 doi:10.1098/rstb.2011.0387
16. Bisogno T, Howell F, Williams G, Minassi A, Cascio MG, Ligresti A. et al. Cloning of the first sn1-DAG lipases points to the spatial and temporal regulation of endocannabinoid signaling in the brain. J Cell Biol. 2003;163:463-8 doi:10.1083/jcb.200305129
17. Hsu KL, Tsuboi K, Adibekian A, Pugh H, Masuda K, Cravatt BF. DAGLbeta inhibition perturbs a lipid network involved in macrophage inflammatory responses. Nat Chem Biol. 2012;8:999-1007 doi:10.1038/nchembio.1105
18. Subramanian A, Tamayo P, Mootha VK, Mukherjee S, Ebert BL, Gillette MA. et al. Gene set enrichment analysis: a knowledge-based approach for interpreting genome-wide expression profiles. Proc Natl Acad Sci U S A. 2005;102:15545-50
19. Zeeberg BR, Feng W, Wang G, Wang MD, Fojo AT, Sunshine M. et al. GoMiner: a resource for biological interpretation of genomic and proteomic data. Genome Biol. 2003;4:R28
20. Stark C, Breitkreutz BJ, Reguly T, Boucher L, Breitkreutz A, Tyers M. BioGRID: a general repository for interaction datasets. Nucleic Acids Res. 2006;34:D535-9
21. Liberzon A, Subramanian A, Pinchback R, Thorvaldsdottir H, Tamayo P, Mesirov JP. Molecular signatures database (MSigDB) 3.0. Bioinformatics. 2011;27:1739-40 doi:10.1093/bioinformatics/btr260
22. Ashburner M, Ball CA, Blake JA, Botstein D, Butler H, Cherry JM. et al. Gene ontology: tool for the unification of biology. The Gene Ontology Consortium. Nat Genet. 2000;25:25-9
Author contact
![]() Corresponding author: GW: gareth.2.williamsac.uk.
Corresponding author: GW: gareth.2.williamsac.uk.