ISSN: 1839-9940

 Global reach, higher impact
J Genomics 2014; 2:121-130. doi:10.7150/jgen.8833 This volume Cite
Research Paper
Characterization of Distinct Classes of Differential Gene Expression in Osteoblast Cultures from Non-Syndromic Craniosynostosis Bone
Monica L. Rojas-Peña1, Rene Olivares-Navarrete2, Sharon Hyzy2, Dalia Arafat1, Zvi Schwartz2, Barbara D. Boyan2,3, Joseph Williams4, Greg Gibson1 ![]()
1. Center for Integrative Genomics, School of Biology, Georgia Institute of Technology, Atlanta, GA, USA.
2. Department of Biomedical Engineering, School of Engineering, Virginia Commonwealth University, Richmond, VA.
3. Department of Biomedical Engineering, Georgia Institute of Technology, Atlanta, GA.
4. Center for Craniofacial Disorders, Scottish Rite Hospital and Children's Healthcare of Atlanta.
Published 2014-8-1
Abstract
Craniosynostosis, the premature fusion of one or more skull sutures, occurs in approximately 1 in 2500 infants, with the majority of cases non-syndromic and of unknown etiology. Two common reasons proposed for premature suture fusion are abnormal compression forces on the skull and rare genetic abnormalities. Our goal was to evaluate whether different sub-classes of disease can be identified based on total gene expression profiles. RNA-Seq data were obtained from 31 human osteoblast cultures derived from bone biopsy samples collected between 2009 and 2011, representing 23 craniosynostosis fusions and 8 normal cranial bones or long bones. No differentiation between regions of the skull was detected, but variance component analysis of gene expression patterns nevertheless supports transcriptome-based classification of craniosynostosis. Cluster analysis showed 4 distinct groups of samples; 1 predominantly normal and 3 craniosynostosis subtypes. Similar constellations of sub-types were also observed upon re-analysis of a similar dataset of 199 calvarial osteoblast cultures. Annotation of gene function of differentially expressed transcripts strongly implicates physiological differences with respect to cell cycle and cell death, stromal cell differentiation, extracellular matrix (ECM) components, and ribosomal activity. Based on these results, we propose non-syndromic craniosynostosis cases can be classified by differences in their gene expression patterns and that these may provide targets for future clinical intervention.
Keywords: Non-syndromic craniosynostosis, RNA-Seq, Transcriptome profile, Personalized medicine, Biomarkers.
Introduction
Craniosynostosis, which occurs in approximately 1 in 2500 infants, is defined as the premature fusion of one or more cranial sutures in infants (1). Craniosynostosis can be syndromic or non-syndromic and is generally classified according to the affected suture as sagittal, coronal, lambdoid, or metopic. A rise in the incidence of metopic synostosis has been documented (2-4), suggesting an environmental component, though increased sibling risk also implies genetic influences even in non-syndromic cases (5).
The molecular genetic mechanisms leading to syndromic craniosynostosis have been well-characterized (6). There are more than 100 craniosynostosis syndromes described from particular gene mutations involved in cranial development, including FGFR1-3, TWIST1, EFNB1, FBN1, MSX2, RAB23, RECQL4, TGFBR1-2 and ERF (6-9). Biomechanical forces have also been implicated as a cause in premature suture closure, by osseous bridging transversally to the suture (10). However, eighty percent of cases are single-suture and/or non-syndromic craniosynostosis, for which a particular detectable cause is unknown (1). Atypical growth of the cranium could be related to aberrant mechanical pressure on the developing skull in utero, compromising cerebral blood flow (11). Alternatively, it could be result from rare genetic abnormalities, presumably inherited as homozygous recessive or compound heterozygous combinations or arising de novo in the affected child, which intrinsically alter gene expression in relevant cell types such as osteoblasts.
Whole transcriptome microarray-based gene expression profiling has been used to query differences between normal controls, syndromic and non-syndromic cases, as reviewed by Bernardini et al. (12). Two studies have contrasted fibroblast cultures (13, 14), two have examined suture biopsies (15, 16), and two considered osteoblast cultures derived from suture sites (15, 17). Despite differences in experimental design and analysis, a common theme is that multiple pathways of gene activity differentiate craniosynostosis from normal tissues, typically implicating the extracellular matrix, fibroblast growth factor and Wnt signaling pathways, apoptosis, cell proliferation, or vascular function. There is evidence that specific syndromes have characteristic gene expression profiles, since Apert and Cruzon syndromes (13) can be discriminated by fibroblast gene expression. There is also some suggestion that osteoblasts derived from different suture locations may differ, reflecting their embryonic origin from neural crest or parietal mesoderm. Mesodermal, but not neural crest, modification of FGFR2 activity in a mouse model of Apert syndrome is sufficient to cause aberrant sutural osteogenesis (18). Our goal was to evaluate whether different sub-classes of disease can be identified based on total gene expression profiles, using RNA-seq to contrast osteoblast cultures from normal and synostosis bone biopsies. These results provide an independent validation of published microarray-based analyses showing abnormal transcription in non-syndromic craniosynostosis osteoblasts (17). Our hypothesis is that classification of craniosynostosis sub-groups based on gene expression may identify biochemical pathways that are specifically modified in each individual that may be considered as targets for individualized therapeutic intervention.
Materials and Methods
Cell culture and RNA isolation
Calvarial samples from craniosynostosis cases were obtained from discarded tissues during surgical reconstruction procedures at Children's Healthcare of Atlanta under IRB approval from Georgia Institute of Technology and Children's Healthcare of Atlanta. Upon removal from the cranial vault, bone pieces were immediately placed in Dulbecco's modified Eagle's medium supplemented with 3% penicillin-streptomycin. Pieces were incubated in 0.25% trypsin-EDTA for 15 minutes to remove contaminating fibroblasts. Osteoblasts from normal bone or fused suture were cultured from 1mm2 bone pieces using the explant technique (19).
RNA was isolated using the TRIzol® extraction method. The quality of 1µL of each sample was checked using an Agilent Bioanalyzer 2100 to determine the RIN (RNA Integrity) score using the Agilent RNA 6000 Nano chip and reagents. Samples with a RIN score >7 were retained and converted to cDNA by Illumina RNA seq kit for sequence library preparation using the Illumina TruSeq RNA Sample Prep Guide: Low Throughput (LT) Protocol. The final libraries were then sequenced on an Illumina HiSeq 2000 at the Vanderbilt University genomics core facility.
RNA-Seq statistical analysis
A total of 31 osteoblast culture samples where sequenced, derived from 8 normal bones (4 skull and 4 long bone), as well as 23 craniosynostosis skull samples (7 metopic; 8 coronal; 3 lambdoid; 5 sagittal). An average of 37 million paired-end 100bp reads was obtained per sample. The raw RNA-Seq reads for each sample were aligned to the reference human genome (hg19) using Bowtie as the short read aligner, and splice junctions were identified using TopHat in the Tuxedo protocol (20). After alignment, raw sequence read depths were converted to estimated transcript abundance measures as fragments per kilobase of exons per million (FPKM) values using Cufflinks (20). All genes with an FPKM greater than 2 averaged across all 31 samples were retained, representing 8025 genes, without any attempt to distinguish alternate transcripts. FPKM values were transformed to logarithm base 2 and normalized using the supervised normalization of microarray (SNM) procedure with the R package from Bioconductor (21).
The dataset is available at the Gene Expression Omnibus, accession number GSE55282.
Following preliminary exploration of the raw data, we modeled cluster type (with four levels) as the biological variable, and adjusted for the effects of gender and location of the synostosis. This normalization approach optimizes the detection of subtype differences while controlling for (but not eliminating) gender and suture location. All subsequent statistical analyses were carried out using JMP Genomics (SAS Institute, Cary, NC, USA) using the basic gene expression workflow. FPKM normalized values were imported into JMP genomics for principal components analysis (PCA), assessment of the biological principal variance component contributions (PVCA), and hierarchical clustering using Ward's method to identify sub-types of expression profile. Finally, the estimate builder function in JMP-Genomics was used to perform analysis of variance (ANOVA) of pairwise contrasts of cluster differences with a false discovery rate (FDR) of 10% cutoff for inclusion in downstream analysis.
Functional annotation was performed using the ToppGene Suite (22) to identify enriched gene sets at the Bonferroni-corrected p<0.05 threshold from a hypergeometric comparison of the proportion of genes differentially expressed in each class relative to their representation in the human genome. Enrichment was evaluated independently on the lists of unique genes down regulated or up regulated for each of the three craniosynostosis sub-types. We evaluated enrichment in the following ToppFun gene annotations categories: Molecular Function: Biological Process, Mouse Phenotype, Pathway, Protein Interactions, Transcription factor-binding sites, miRNA-target genes, Disease-gene associations, and Drug-gene interactions.
Re-analysis of published dataset
Stamper et al. (17) reported parallel calvarial osteoblast gene expression profiling from single-suture non-syndromic craniosynostosis samples, but using Affymetrix oligonucleotide microarray profiling. Their report focused on differential expression between 199 cases and 50 controls. We downloaded their data (GEO accession number GSE27976) and confirmed that the control samples cluster for the most part as a separate group of samples. However, we also noticed four major groups of craniosynostosis profiles (Additional file 1: Suppl. Fig. 1). Although thousands of genes differentiated these sub-classes, they were not enriched for any gene functions, and inspection of the array numbers showed that the four groups (that were not reported by Stamper et al. (17)) followed the numbering of the arrays in the dataset with few exceptions. We conclude that this clustering represents a technical artifact due to a batch effect. We therefore removed the cluster effects by following the SNM procedure with Code (synostosis type) as the biological variable, and Cluster identity as the adjustment variable, which was removed. Reclustering of this newly normalized dataset, consisting solely of the craniosynostosis samples, revealed four new clusters uncorrelated with the presumed technical batch clusters. These are referred to as Stamper clusters SC1 through SC4.
Results
Principal Component Analysis of Gene Expression
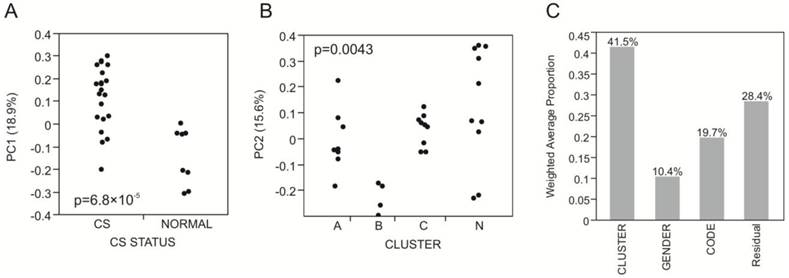
The first five principal components of transcriptional variation in our 31 RNA-Seq samples capture 59% of the total variance in the expression of 8,025 genes. Notably, PC1 (18.9%) was significantly different between the 8 normal and 23 craniosynostosis samples (p<0.0001; Fig. 1A), strongly suggesting that osteoblasts from fused sutures have different gene expression profiles that persist even in cell culture. In contrast, none of the first 5 PC showed any differential expression with respect to location of the synostosis, indicating that there are no gross differences between these traditionally defined sub-classes of non-syndromic disease.
Variance component analysis of gene expression profiles. (A) PC1 differentiates Normal and craniosynostosis samples (t-test, p<0.0001). (B) PC2 largely captures the difference between Cluster B and all other samples (ANOVA, p=0.0043; t-test p-values for comparison with Cluster A and Cluster C are 0.0230 and 0.0069 respectively). (C) Shows the weighted average of the variance captured by the first five principal components that is explained by Cluster, Gender and Code (location of the suture), indicating that most of the variance is among the four clusters A, B, C and N.
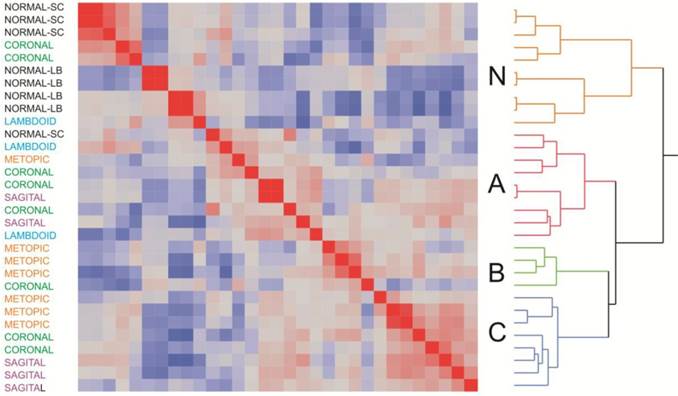
Clustering of samples according to overall similarity (Fig. 2) confirmed these results. Seven of the of the normal samples form a distinct group along with two of the craniosynostosis samples, while the remaining 21 craniosynostosis samples were no more likely to cluster according to region than expected by chance. However, it is noteworthy that the first cluster of mostly normal samples does appear to separate into two sub-groups of skull or long bone samples, suggesting a subtle difference between of these two sources of osteoblasts.
Two-way hierarchical clustering of craniosynostosis samples. The heat map represents the overall similarity of profiles from low (blue) to high (red) indicating two major clusters of expression profiles corresponding to 8025 transcripts in 31 individuals. The Normal cluster also shows a suggestion of differentiation between long bone and skull-derived osteoblast cultures. Within craniosynostosis groups, there are three clusters (A, B, and C). There is no significant correlation between site of synostosis (indicated at the left) and overall clustering of profiles.
Three sub-groups were observed in the craniosynostosis group, which are labeled A, B and C. Group A may have two sub-types, but this difference is less strongly supported by bootstrap analysis than the major sub-groups. Group B is significantly differentiated from A and C for PC2 in the principal component analyses (Fig. 1B). The robustness of the groups was tested using 10,000 bootstrap replications (Additional file 1: Suppl. Fig. 2) of the hierarchical clustering, implemented using pvclust in R (23). They were also confirmed using three different clustering methods (Centroid, Average linkage, and Ward) in JMP 9.0 (SAS Institute, Cary, NC, USA), and by relaxing the inclusion threshold to include all transcripts with FPKM 1.0 or greater (10,409 transcripts). The results presented in Additional file 1: Suppl. Fig. 2 confirm the existence of 4 groups of samples, one mostly normal and three craniosynostosis sub-types.
ANOVA and Gene Ontology Analysis
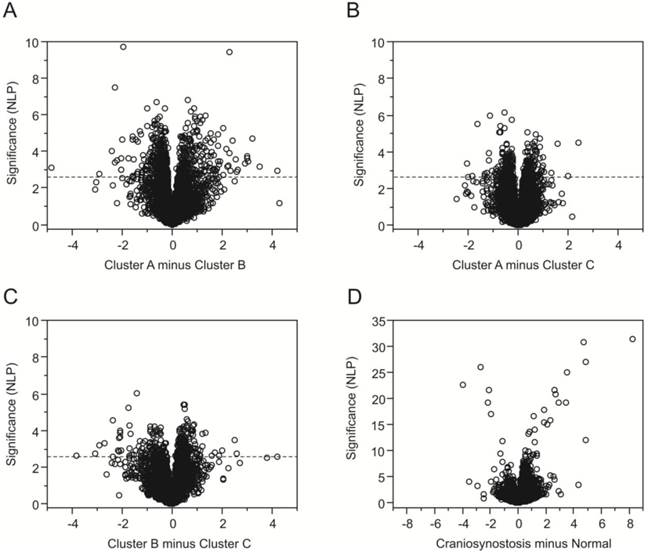
Having identified three subgroups of craniosynostosis samples, we next used ANOVA to identify genes that were differentially expressed relative to normal osteoblasts and genes differentially expressed between the sub-groups. Differential expression is visualized as volcano plots (Fig. 3A-D) showing the significance (negative logarithm of the p-value, NLP) on the y-axis, relative to the difference in transcript abundance on the x-axis. Fig. 3D confirms that the greatest differentiation (1768 genes at a FDR of 10%) is observed between the normal samples and the craniosynostosis samples consistent with the clustering analysis. Genes more highly expressed in craniosynostosis osteoblast cultures than in cultures of normal osteoblasts are to the right and genes down regulated in comparison are to the left, with high significance to the top. Note the difference in scale of the y-axis compared with 3A-C.
Volcano plots contrasting gene expression in clusters of samples. Each plot indicates the significance on the y-axis (negative log P) against the magnitude differential expression on the log2 scale. Each gene is indicated by a circle, and the q-value 5% FDR cutoff is indicated by the horizontal line at NLP 2.64 for the comparisons of the craniosynostosis clusters in (A) through (C). Plot (D) contrasts normal and all craniosynostosis samples, and is drawn to a different scale since the differentiation of some genes is much stronger.
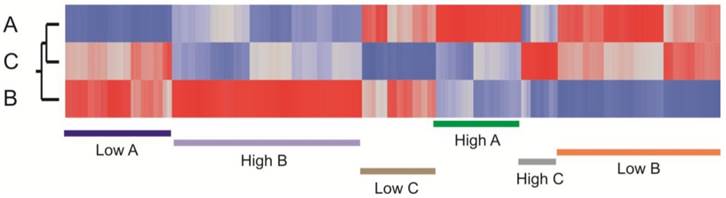
Among the craniosynostosis samples, 880 genes were identified by ANOVA as differentially expressed among the three groups of craniosynostosis at a FDR of 10%. Figure 4 shows a heat map of all of these genes, and clearly indicates sets of genes that are representative for all six patterns of differential expression: genes up-regulated in A (green), down-regulated in A (blue), up-regulated in B (purple), down-regulated in B (pink), up-regulated in C (gray), or down-regulated in C (brown). Group C has the fewest genes with biased expression. To quantify these patterns, we also performed pair-wise contrasts of the three groups and selected genes that were significant (p<0.001, NLP >3) for each of the six pairs of conditions (A>B and A>C; A<B and A<C; B>A and B>C; B<A and B<C; C>A and C>B; C<A and C<B). The 1,769 genes satisfying those contrasts are listed in Additional file 2: Suppl. Table 1.
Heat map showing clustering of transcripts that differentiate the sub-clusters of craniosynostosis samples. The plot is based on the standardized least square mean estimates for 880 genes that are significant at 5% FDR for at least one of the pairwise contrasts of the three cluster types. Red bars represent up-regulated transcripts and blue down-regulated transcripts. Genes up regulated in A (green), down regulated in A (blue), up regulated in B (purple), down regulated in B (orange), up regulated in C (gray), or down regulated in C (brown) are highlighted.
Gene ontology analysis was performed using the ToppFun suite to identify sets of genes that are enriched in craniosynostosis clusters at a Bonferroni-corrected p-value less than 0.05 (Additional file 3: Suppl. Table 2). This provides evidence for differential expression of proteins that are involved in multiple biological functions and molecular processes. Group A shows up regulation of genes known to be representative of embryonic cranial skeletal morphogenesis (for example, TWIST1 and PDGFRA), stromal cell differentiation, and protein localization to the endosomal membrane. Genes down regulated in Group A are enriched for involvement in ribosomal and ribonucleoprotein complex biogenesis. Group B showed the most enrichment, with up regulation of structural constituents of the ribosome, mitochondrial membrane components, cell cycle checkpoint and apoptosis regulators, and cell stress mediators. Genes down regulated genes in Group B were related to ECM structure and dynamics (for example COL14A1, COL8A2, COL11A1 and LAMB), proteins involved in calcium binding and cell morphogenesis (notably NOTCH3, JAG1), or cytoskeletal components. Cluster C had less significant enrichment, but we noted up regulation of proteins involved in the cytoskeleton, chondroitin sulfate biosynthetic and metabolic processes, and collagen fibril organization.
Comparison with Microarray-based gene expression data
While analyzing our data, we became aware of a recently published study (17) of a similar but larger sample of suture osteoblast cultures from 199 non-syndromic cases of craniosynostosis. They focused their analyses on contrasts between sagittal, coronal, and metopic cases, also including 50 healthy controls. Examining the 2000 genes considered to have reliable information content, they found 736 that were differentially expressed at p<0.05, 49 of which also had 50% or more differential expression relative to control. The sagittal samples were most differentiated, and biological inference focused on FGF7, SFRP4, and VCAM1 as well as FGF/IGF/WNT signaling. We found similar levels and types of differential expression on our comparison of non-syndromic with normal osteoblasts to those documented above, despite the different technology (Affymetrix hybridization arrays rather than RNA-Seq).
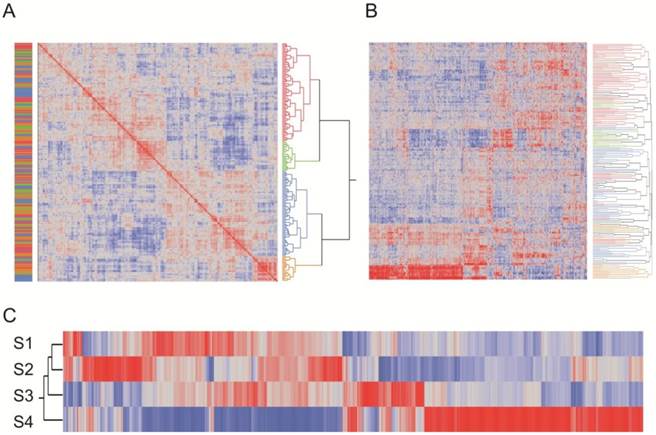
After statistically removing what appears to be a technical batch effect from their data (see methods, Additional file 1: Suppl. Fig. 1), we ran a similar analysis pipeline as for our data and observed four sub-types of craniosynostosis profile (Figure 5A). The first 5 principal components explain 47.4% of the overall variation, 52% of which is explained by the four cluster types whereas only 1.0% is due to suture location. There was not a significant correlation between suture location and cluster type, but we did observe a small correlation between technical batch effect and suture location, suggesting that the differences between sagittal and metopic/coronal samples may be attributed at least in part to this artifact. Thousands of genes differentiate each of the four biological sub-types at the 5% FDR level, reflecting both the power of the comparison with an average of 50 samples per sub-type and the fact that the sub-type differences are a much greater source of variance than suture location. Analysis of only the 1141 transcripts significantly different between clusters at p<10-20 recapitulates the overall cluster identities (Figure 5B). Figure 5C shows standardized average gene expression among the Stamper sub-types.
Reanalysis of the Stamper microarray dataset. (A) Clustering of craniosynostosis samples by overall similarity (as in Figure 2) shows 4 clusters of samples. Colors to the left indicate the technical clusters observed in the raw data (Additional file 1: Suppl. Figure 2), and indicate that this effect has been effectively removed by the SNM normalization procedure. (B) Two-way hierarchical clustering of 2883 probes significantly different in any pairwise contrast at NLP10 tends to recapitulate the four clusters. Each row is a sample, and column a transcript, and most of the rows are clustered with respect to the assignments in (A). The plot also clearly indicates genes that are specifically up regulated or down regulated in each cluster type. (C) Heat map of standardized least square means of genes within the four cluster types.
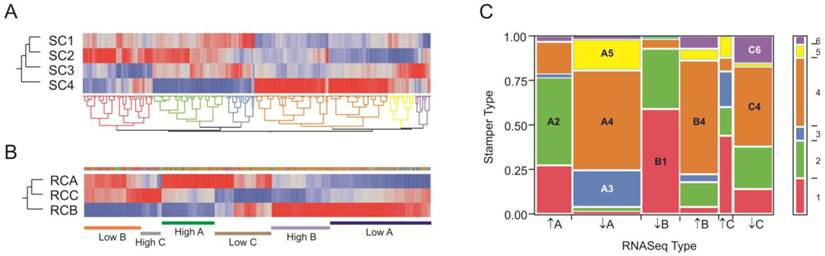
To compare our dataset with the larger Stamper et al. (17) dataset, we extracted 1,728 transcripts that were specific for our RNA-Seq clusters RC-A through RC-C at NLP>5, and asked whether they tend to be in the same sub-types in the Stamper dataset of 2,883 probes at NLP > 10 that are characteristic of the four sub-types SC1 through SC4. Figure 6 panels A and B show the clustering of the 428 genes in common, where each is partitioned into 6 sub-sets of co-regulated transcripts. For the RNA-Seq data, these clusters correspond to up- or down-regulation of genes in each of the three clusters; for the Stamper data, they also correspond to cluster-specific expression. Panel C presents the frequency of genes in each of the 36 possible 6 × 6 matrix of sets and shows that there is highly significant overlap (p<10-60 likelihood ratio test of clustering of categories). Of the 428 genes in common, 280 (65%) are present in the eight groups highlighted in the panel. There was very strong overlap between the red, green, and blue Stamper sets on the left half of Panel A with generally low expression in SC4 and high expression in SC2, and the left half of the RNA-Seq data in Panel A with high expression in clusters A and C but low expression in cluster B. Conversely, the brown, yellow, and purple Stamper clusters dominate the low in A and C, high in B RNA-Seq clusters. Superimposed in this are differences in the relative abundance of the subsets of gene expression. We conclude that the six groups of genes represent highly co-regulated patterns of variation in gene expression in the osteoblasts that are consistently found in the two independent datasets ascertained with two different transcript-profiling strategies.
Comparison of RNA-Seq and Stamper datasets. (A) Heat map of standardized least square means of abundance levels of 428 transcripts significantly differentially expressed between the 4 clusters of Stamper samples (NLP>10), as well as the 3 clusters of RNA-Seq samples (NLP > 5), in the Stamper dataset. (B) The same 428 genes in the RNA-Seq dataset. The narrow band of color above the three cluster profiles correspond to the sets of genes indicated in (A), while the bars below the plot indicate genes that are up- or down-regulated in the indicated clusters. (C) Matrix of correspondence of sets of genes in (A) and (B) ordered by high or low expression in clusters A, B, and C in the RNA-Seq dataset. The bar to the right shows the proportion of genes in each Stamper set, color-coded as in (A). The eight largest sets of co-varying genes in both datasets are labeled, and listed in Additional file 4: Suppl. Table 3.
Although the individual clusters of profiles are not the same in the two experiments, the highly significant overlap in covariance indicates that a small number of gene sets might be used to define the sub-type of craniosynostosis. Gene ontology analysis of just the small number of genes that are diagnostic of these sets of these expression sets suggests important enrichments that are documented in Additional file 4: Suppl. Table 3 along with the gene identities in each set. Notably 9 of the 42 genes in set B1 are extracellular matrix components (enrichment p=6×10⁻⁵), four of which have EGF-calcium binding domains (FBN1, NID1, FBML5 and THBS3 thrombospondin). By contrast, 4 of the 32 genes in set A2 are metallothioneins (MT2A, MT1X, MT1L and MT1E, enrichment p=2×10⁻⁷) and 6 of 46 genes in set B4 are involved in regulation of amino acid metabolism (OAZ2, PSMA1, PSMA3, PSMA5, PSME2, PSMD12, enrichment p=2×10⁻⁵).
Discussion
This is the first study to use RNA sequencing to characterize gene expression profiles of a diverse sample of non-syndromic craniosynostosis cases. We find that osteoblast cultures derived from a site of synostosis tend to be different from those of normal bone, and document different sub-types of synostosis samples. Contrary to the findings of Stamper et al. (17), we do not see any difference in gene expression according to location of the affected suture. They observed highly similar gene expression profiles among coronal and metopic cases but found differences in sagittal samples that our re-analysis suggests are small relative to differences between major biological sub-types that occur in these suture locations. Abnormal bone growth thus appears to be largely independent of the site of synostosis.
The differentiation of normal from craniosynostosis osteoblasts samples implies that the mechanism that produces the differential expression is for the most part stably maintained in culture. Since four of the control samples were from normal skull bone taken from a site distal to the location of premature fusion in craniosynostosis patients, it appears that abnormal gene expression is not a property of all skull-derived osteoblasts of craniosynostosis patients. This implies an epigenetic component to the differential expression, and it is noteworthy that several genes annotated to regulation of DNA methylation are among the differentially expressed genes (e.g. METTL9). Other classes of differential expression between normal and craniosynostosis-derived bone include genes involved in RNA processing and ribosome biogenesis that are up regulated in craniosynostosis osteoblasts, and lipoprotein biosynthesis and protein translation that are down regulated in craniosynostosis osteoblasts. We have not been able to obtain skull biopsy from non-craniosynostosis children, so we cannot say whether the slight difference between skull and long bone reflects the bone of origin or craniosynostosis status. However, clearly both types of normal osteoblasts are more similar to one another than either is to most craniosynostosis cultures.
Transcriptome comparisons among different forms of craniosynostosis sub-classes confirm the hypothesis that there are sub-types of disease and that craniosynostosis is a genetically heterogeneous condition (24). However, our analyses, replicated in an independently generated dataset obtained with a different transcriptome profiling technology, strongly suggest that a small number of pathways lead to abnormal cell behavior in prematurely fused sutures. The nature of the differential gene expression may be used not only to identify sub-classes of disease, but also to aid in therapeutic intervention.
The biological properties of the sub-classes of non-syndromic craniosynostosis that we have identified can be addressed by gene ontology (GO) analysis, which asks whether specific types of gene are over-represented among the transcripts that define each sub-group. For example, GO for group A shows down regulation in ribosome biogenesis which has been related to craniofacial anomalies like Treacher Collins syndrome (25) where observed cranioskeletal hypoplasia is attributed to the generation of insufficient neural crest cells caused by deficient ribosome biogenesis.
GO term enrichment analysis for group B showed that down-regulated genes were mainly associated with cell cycle and division, whereas up-regulated genes were related to development, differentiation, and death. A similar finding was previously reported for Apert syndrome patients (15). GO analyses highlight ECM genes (FBN1, FBLN1 and FLBLN2, ACAN, COL14A1, COL8A2 and COL11A1, MFAP5, PXDN, LAMC1, LAMA4 and LAM1) as being significantly down regulated in-group B suggesting an altered matrix organization. ECM plays an important role in controlling cell behavior and function, and it is important during development because it influences bone differentiation. Differential ECM regulation has also been observed with syndromic Apert syndrome-type craniosynostosis. There is some debate in the literature as to whether matrix mineralization associated with higher calcium incorporation increases with time in Apert syndrome (26-28), since Fanganiello et al. (16) compared gene expression in Apert syndrome biopsies with normal cases and attributed 7 down regulated genes to ECM biogenesis in Apert syndrome patient samples. Stamper et al. (18) confirmed differential expression of ECM genes in craniosynostosis osteoblast cultures.
In-group B we also note JAG1 and NOTCH3, both of which belong to the Notch signaling pathway, which is essential for proper embryonic development. Mutation of these genes has been demonstrated in animal models to cause a condition resembling Alagille syndrome that includes abnormal cranial suture formation (29). Mutations of JAG1 have also been reported in Alagille syndrome patients, who have symptoms that are associated with craniosynostosis (30, 31), implicating the Notch signaling pathway in premature cranial suture formation.
Another important class of biomarker we have identified is enrichment for stromal cell gene expression in-group A. Stromal cells are progenitor cells that can differentiate into mesenchymal lineages, including osteoblasts and chondrocytes among others (32), and have been associated with Cruzon syndrome (33). The up regulation of these genes in groups A and B may simply be an indication that the cultured cells are at a different stage of differentiation than in-group C, or that there is contamination with other cell types in the latter. We did not observe any differential expression of genes that have been shown to mark different stages of osteoblast differentiation (COL2A, COL2B among others), arguing against the groups simply representing stages of growth. Confirmation that biopsy samples differ with respect to stromal cell properties implies a role for gene expression profiling in guiding whether or not to adopt this type of intervention.
Our results provide strong evidence that three or four sub-groups of gene expression represent the majority of types of craniosynostosis transcriptome profile. Although the profiles are not identical to those reported by Stamper et al. (17), the overlap is highly significant, and differences may be attributed to (i) differences in osteoblast cell culture and hence cell populations, (ii) the likelihood that their larger sample sizes will reveal more sub-types, and (iii) microarray versus RNA-Seq technology. Whatever the mechanisms, genetic or mechanical, that lead to abnormal osteoblast gene expression, the sub-classification of patients may have therapeutic implications as treatments can be targeted at specific molecules that are aberrantly expressed in the subtype. It will be important to develop animal models that mimic these non-syndromic differences so that the effect of strategies designed to biologically engineer the ECM or cell growth and division can be evaluated.
Supplementary Material
Additional File 1Supplementary Figures 1-2.
Supplementary Table 1.
Supplementary Table 2.
Supplementary Table 3.
Acknowledgements
We thank to the Georgia Tech and Children's Health Care of Atlanta Center for Pediatric Healthcare Innovation for funding this research as a pilot project, and the patients and families for consenting to participate.
Competing Interests
The authors have declared that no competing interest exists.
References
1. Cohen MM, MacLean RE. Craniosynostosis: Diagnosis, evaluation, and management. New York, USA: Oxford University Press. 2000
2. Boulet SL, Rasmussen SA, Honein MA. A population-based study of craniosynostosis in metropolitan Atlanta, 1989-2003. Am J Med Genet A. 2008;146A:984-991
3. Di Rocco F, Arnaud E, Renier D. Evolution in the frequency of nonsyndromic craniosynostosis. J Neurosurg Pediatr. 2009;4:21-25
4. Fisher DC, Kornrumpf BP, Couture D. et al. Increased incidence of metopic suture abnormalities in children with positional plagiocephaly. J Craniofac Surg. 2011;22:89-95
5. Boyadjiev SA for the International Craniosynostosis Consortium. Genetic analysis of non-syndromic craniosynostosis. Orthod Craniofac Res. 2007;10:129-137
6. Wilkie AO. Craniosynostosis: genes and mechanisms. Hum Mol Genet. 1997;6:1647-56
7. Ma L, Golden S, Wu L. et al. The molecular basis of Boston-type craniosynostosis: the Pro148-His mutation in the N-terminal arm of the MSX2 homeodomain stabilizes DNA binding without altering nucleotide sequence preferences. Hum Mol Genet. 1996;5:1915-1920
8. Muenke M, Gripp KW, McDonald-McGinn DM. et al. A unique point mutation in the fibroblast growth factor receptor 3 gene (FGFR3) defines a new craniosynostosis syndrome. Am J Hum Genet. 1997;60:555-564
9. Fitzpatrick DR. Filling in the gaps in cranial suture biology. Nat Genet. 2013;45:231-232
10. Oppenheimer AJ, Rhee ST, Goldstein SA. et al. Force-induced craniosynostosis in the murine sagittal suture. Plast Reconstr Surg. 2009;124:1840-1848
11. Tamburrini G.M, Caldarelli L, Massimi P. et al. Intracranial pressure monitoring in children with single suture and complex craniosynostosis: a review. Childs Nerv Syst. 2005;21:913-921
12. Bernardini C, Barba M, Tamburrini G. et al. Gene expression profiling in human craniosynostoses: a tool to investigate the molecular basis of suture ossification. Childs Nerv Syst. 2012;28:1295-1300
13. Carinci F, Bodo M, Tosi L. et al. Expression profiles of craniosynostosis-derived fibroblasts. Mol Med. 2002;8:638-44
14. Bochukova EG, Soneji S, Wall SA. et al. Scalp fibroblasts have a shared expression profile in monogenic craniosynostosis. J Med Genet. 2010;7:803-808
15. Coussens AK, Wilkinson CR, Hughes IP. et al. Unravelling the molecular control of calvarial suture fusion in children with craniosynostosis. BMC Genomics. 2007;8:458
16. Fanganiello RD, Sertie AL, Reis EM. et al. Apert p.Ser252Trp mutation in FGFR2 alters osteogenic potential and gene expression of cranial periosteal cells. Mol Med. 2007;13:422-442
17. Stamper BD, Park SS, Beyer RP. et al. Differential expression of extracellular matrix-mediated pathways in single-suture craniosynostosis. PLoS ONE. 2011;6:e26557
18. Holmes G, Basilico C. Mesodermal expression of Fgfr2S252W is necessary and sufficient to induce craniosynostosis in a mouse model of Apert syndrome. Dev Biol. 2012;368:283-293
19. Olivares-Navarrete R, Hyzy SL, Chaudhri RA. et al. Sex dependent regulation of osteoblast response to implant surface properties by systemic hormones. Biol Sex Differ. 2010;1:4
20. Trapnell C, Trapnell C, Roberts A, Goff L. et al. Differential gene and transcript expression analysis of RNA-seq experiments with TopHat and Cufflinks. Nat Protoc. 2012;7:562-578
21. Mecham BH, Nelson PS, Storey JD. Supervised normalization of microarrays. Bioinformatics. 2010;26:1308-1315
22. Chen J, Bardes EE, Aronow BJ. et al. ToppGene Suite for gene list enrichment analysis and candidate gene prioritization. Nucleic Acids Res. 2009;37:305-311
23. Suzuki R, Shimodaira H. Pvclust: an R package for assessing the uncertainty in hierarchical clustering. Bioinformatics. 2006;22:1540-1542
24. Panigrahi I. Craniosynostosis genetics: The mystery unfolds. Indian J Hum Genet. 2011;17:48-53
25. Trainor PA, Dixon J, Dixon MJ. Treacher Collins syndrome: etiology, pathogenesis and prevention. Eur J Hum Genet. 2009;17:275-283
26. Bodo M, Carinci F, Baroni T. et al. Apert's syndrome: differential in vitro production of matrix macromolecules and its regulation by interleukins. Eur J Clin Invest. 1997;27:36-42
27. Lomri A, Lemonnier J, Hott M. et al. Increased calvaria cell differentiation and bone matrix formation induced by fibroblast growth factor receptor 2 mutations in Apert syndrome. J Clin Invest. 1998;101:1310-1317
28. Lemonnier J, Hay E, Delannoy P. et al. Role of N-cadherin and protein kinase C in osteoblast gene activation induced by the S252W fibroblast growth factor receptor 2 mutation in Apert craniosynostosis. J Bone Miner Res. 2001;16:832-845
29. Yen HY, Ting MC, Maxon RE. Jagged 1 functions downstream of Twist1 in the specification of the coronal suture and the formation of a boundary between osteogenic and non-osteogenic cells. Dev Biol. 2010;347:258-270
30. Kamath BM, Stolle C, Bason L. Craniosynostosis in Alagille syndrome. Am J Med Genet. 2002;112:176-180
31. Yilmaz S, Turhan T, Mutluer S. et al. The association of Alagille syndrome and craniosynostosis. Pediatr Neurol. 2013;48:146-148
32. Prockop DJ. Marrow stromal cells as stem cells for nonhematopoietic tissues. Science. 1997;276:71-74
33. Liu J, Kwon TG, Nam HK. et al. Craniosynostosis-associated Fgfr2C342Y mutant bone marrow stromal cells exhibit cell autonomous abnormalities in osteoblast differentiation and bone formation. Biomed Res Int. 2013;2013:1-11
Author Biography
Monica L. Rojas-Peña, MSc. obtained her bachelor's degree from the School of Biology, Universidad Pedagogica y Tecnologica de Colombia in 2006 and her Master's Degree in Biological Oceanography at the University of Puerto Rico in 2010. She is currently a Ph. D. student at Georgia Institute of Technology under the supervision of Prof. Greg Gibson. Her research is focus on gene expression profiling of bone diseases.
Dr. Rene Olivares-Navarrete, D.D.S, Ph.D. is Assistant Professor in the Department of Biomedical Engineering at Virginia Commonwealth University. His research interests relate to the effects of surface modification of Dental and Orthopedic Implants, and the impact of growth and signaling molecules on bone development and regeneration. Ms Sharon Hyzy worked with him on this project while they were still at Georgia Tech, and she is now Senior Research Associate at VCU.
Dr. Barbara D. Boyan, Ph.D. is Dean of the School of Engineering, Professor of Biomedical Engineering, and Goodwin Chair in Tissue Engineering at Virginia Commonwealth University. She received her B.A., M.A. and Ph.D. in biology from Rice University. Dr. Boyan was elected to the National Academy of Engineering in 2012. She is the author of more than 370 peer-reviewed papers, reviews, and book chapters and holds 14 U.S. patents on topics related to engineering of the response of cells to biomaterials, mechanisms of action of hormones and growth factors in cartilage and bone, and stem cell delivery technologies. She has enjoyed a long-term collaboration with Dr Zvi Schwartz who is now Associate Dean for Strategic Initiatives for the School of Engineering at VCU.
Dr. Joseph Williams, M.D. is Chief of Plastic Surgery at Children's Healthcare of Atlanta at Scottish Rite, Director of Research at the Center for Craniofacial Deformities, and also an Associate Professor at Emory University in the division of Plastic Surgery. Dr. Williams sustains a plastic and reconstructive surgery practice dedicated to the treatment of patients with congenital birth defects and traumatic injuries.
Dr. Greg Gibson, Ph.D. is Professor of Biology and Director of the Center for Integrative Genomics at the Georgia Institute of Technology. An Australian, he obtained his PhD in developmental biology at the University of Basel, was a post-doctoral fellow at Stanford, and studied Drosophila evolutionary genetics for 15 years before turning his attention to issues of how genetics and the environment combine to alter susceptibility to disease, and how genomics can be used in personalized medicine. Dr. Gibson is Section Editor for Natural Variation for PLoS Genetics and serves on the editorial board of Genome Medicine.
![]() Corresponding author: Greg Gibson, Professor of Biology. Address: Center for Integrative Genomics, School of Biology, Georgia Institute of Technology, Atlanta, GA 30332. Telephone number: 404-385-2343, fax number: 404-894-0519 email: greg.gibsongatech.edu.
Corresponding author: Greg Gibson, Professor of Biology. Address: Center for Integrative Genomics, School of Biology, Georgia Institute of Technology, Atlanta, GA 30332. Telephone number: 404-385-2343, fax number: 404-894-0519 email: greg.gibsongatech.edu.