ISSN: 1839-9940Journal of Genomics

J Genomics 2014; 2:20-30. doi:10.7150/jgen.4089 This volume Cite
Research Paper
Analysis of Diversity and Linkage Disequilibrium Mapping of Agronomic Traits on B-Genome of Wheat
Haixia Yu, Zhiying Deng, Changfen Xiang, Jichun Tian ![]()
State Key Laboratory of Crop Biology, Shandong Key Laboratory of Crop Biology, Shandong Agricultural University, Taian, Shandong, China
Abstract
Association mapping is an efficient method to test the association between molecular markers and quantitative trait loci (QTL) based on linkage disequilibrium (LD). In this study, 13 agronomic traits of 109 wheat accessions were evaluated at Tai'an of China in 2006-2010. Genetic diversity, population structure, and LD were investigated using Diversity Array Technology (DArT) markers. The extent of LD on B-genome (chromosomes 1B, 2B, 3B, 4B, 5B, 6B and 7B) was about 18-27 cM. The polymorphism information content (PIC) value of markers in the LD blocks was often lower than the mean value of each chromosome. Analysis of the phenotypic diversity of the 13 traits showed that the population structure accounted for an average of 5.82% of the phenotypic variation. Association of 139 DArT markers on chromosome 1B-7B with the 13 traits was analyzed with a mixed linear model. A total of 84 significant marker trait associations (MTAs) were found and some of the associated markers were located in the QTL region detected in previous linkage mapping studies. Combined with hitchhiking effects, we identified five important markers for future analysis, such as wPt-1708(4B, 93.8cM), wPt-3457(5B, 92.3cM), wPt-9613(5B, 94.4cM), wPt-4858(6B, 66.1cM) and wPt-8598(7B, 142.4cM). The information obtained in this study should be useful for marker-assisted selection in wheat breeding programs.
Keywords: Association mapping, Agronomic traits, Linkage disequilibrium, DArT markers, hitchhiking effects
Introduction
Wheat is a major staple food in the world. Most agronomic traits related to yield in wheat are quantitative. Mapping these traits not only help us in understanding the genetics, but also can contribute to marker assistant selection and provide the baseline for gene clone.
Besides the conventional linkage mapping, an alternative means of detecting gene effects is association mapping. A complete overview on association mapping and the status of this approach in plant research has been published recently [1]. At present, association mapping has been widely used in studies of many plants, such as maize [2-5], barley [6], wheat [7-8], etc. Association mapping studies in bread wheat are extended to several agronomic traits, such as grain yield, the quantity of a high molecular-weight glutenin and disease resistance [7, 9-13], etc.
Association mapping is based on LD analysis, i.e., the nonrandom association of alleles at different loci [14]. It determines the resolution of association mapping. If LD decays rapidly, the resolution of association mapping is high and lowed by contraries [15]. To date, the extent of LD patterns in bread wheat have been investigated widely [7, 16-18]. For example, strong LD was found to occur on the average within <1 and 5 cM for the region on chromosome 2D and centromeric region 5A that was surveyed with SSR markers in 95 cultivars of winter wheat by Breseghello and Sorrells [7]. Chao et al. [17] revealed that the genome-wide LD was generally less than 1 cM for the genetically linked loci pairs and less than 10 cM apart for most of the LD regions observed. Somers et al. [18] suggested that LD mapping of wheat can be performed with SSRs to a resolution of <5 cM. Tommasini et al. [11] reported that the LD on chromosome 3B extended up to 0.5 cM in 44 varieties or 30 cM in a 249 RIL population of winter wheat. Neumann et al. [13] found the LD decayed within 4 cM in 96 winter wheat accessions with 525 DArT markers. These suggested that LD should likely vary widely among wheat populations.
In order to achieve a high resolution for association analysis, a large number of molecular markers sets such as DArT are usually preferred for association mapping. DArT is a microarray-based DNA marker technique for genome-wide discovery and genotyping of genetic variation which is independent of sequence information, being able to simultaneously type several thousand loci per assay. A first genome-wide association mapping study in wheat, exploiting DArT marker technology, was published by Crossa et al. [10]. Using the DArT markers, they and subsequent researchers determined traits less involved in specific aspects of spike and kernel, such as fertile spikelet number, spike density, kernel diameter, kernel hard. Here, we report a DArT-based association study of 109 winter wheat accessions of diverse origins, evaluated for a set of 13 agronomic traits over a number of seasons on the seven chromosomes of the B genome. The aims were to investigate the genetic and phenotypic diversity, determine the patterns of population structure and LD, evaluate the effect of population structure on phenotype, implement association analysis, and finally identify significant markers for future analysis.
Materials and methods
Plant material and field trials
A total of 109 wheat accessions (Triticum aestivum L.) were used in this study. Of which, 101 accessions were from different geographic areas (Provinces of Shandong, Jiangsu, Anhui, Hebei, Henan, Shanxi, and so on) in China. There were only 8 accessions from elsewhere in the world.
Field trials were conducted under five environments in 2006-2010 in Tai'an, Shandong Province, China (Table 1). The experimental design followed a completely randomized block design with two replications in each environment. In autumn each year, all varieties were planted in 2-m-long four-row plots (25 cm apart). Management was in accordance with local practices. There were no lodging and serious pests and diseases in these growing seasons.
Phenotypic data
Traits evaluated include plant height (PH, cm), spike length (SL, cm), The first internode length counted from the top (FIITL, cm), total spikelet number per spike (TSN), fertile spikelet number (FSN), sterile spikelet number (SSN), spike density (SD, which was scored as TSN divided by SL than multiplied by 100), grain number per spike (GN), grain weight per spike (GW, g), thousand-kernel weight (TKW, g), flag leaf (FL, cm2), kernel diameter (KD, mm), kernel hard (KH). KD and KH were measured using Perten SKCS4100 (Single Kernel Characterization System).
Genotypic data
DNA of the 109 wheat accessions was extracted from adult-plant leaves of five individuals using the cetyl trimethyl ammonium bromide (CTAB) method [19]. And then genotyped by DArT markers at the Diversity Arrays Technology Pty Limited (Canberra, Australia; http://www.triticarte.com.au). Each of the informative markers was designated by the prefix 'wPt'. Assignment of 139 DArT markers to linkage B-genome was based on Crossa et al. [10].
Data analyses
Genetic diversity
Powermarker3.25 (Liu and Muse 2005, http://statgen.ncsu.edu/powermarker/) [20] was used to calculate gene diversity, polymorphic information content (PIC), classical Fst values and Nei's genetic distance (1983) [21].
Analysis of variance (ANOVA) was carried out to determine genotypic and environment variances among the traits measured in environments using the general linear model procedure (Proc glm) with SAS program version 8 (SAS Institute Inc., Cary, NC). Broad-sense heritability was calculated as H2=σ2g/( σ2g + σ2e/n), where σ2g is the genotypic variance, σ2e is the environment variance and n is the number of environments.
Population structure
Population structure among wheat accessions was analyzed using the model-based software STRUCTURE 2.2 [22-23]. Five independent runs were performed setting the number of populations (K) from 1 to 10, burn in time and MCMC (Markov Chain Monte Carlo) replication number both to 500,000. The K value was determined by ln P(D) in STRUCTURE output and an ad hoc statistic △K based on the rate of change in ln P(D) between successive K values [24]. Wheat lines with membership probabilities ≥0.5 were assigned to corresponding clusters. Lines with membership probabilities <0.5 were assigned to a mixed group.
Linkage disequilibrium
LD between mapped DArT loci was calculated by the squared allele frequency correlation coefficient (r2) implemented in TASSEL 2.0.1 (http://www.maizegenetics.net). The pair-wise significance was computed by 1,000 permutations after removal of loci with rare alleles (f < 0.10). LD was calculated separately for unlinked loci and loci on the same chromosome of B-genome. A critical value for r2, as an evidence of linkage, was derived using the 95% percentile of unlinked loci according to Breseghello and Sorrells [7]. Within a chromosome region, if all pairs of adjacent loci were in LD, this region was referred to as LD blocks.
Association analysis
Significant marker-trait associations were identified using a mixed linear model (MLM) in TASSEL 2.1. Mix linear model can reduce both type I and type II errors. It simultaneously took into account population structure (Q matrix) and kinship (K matrix) as described by Yu et al. [25]. The population structure was inferred by program STRUCTUTE 2.2 and kinship matrix was calculated by software TASSEL 2.1. The significance of associations between a marker locus and a trait was indicated by the P-value and the QTL effects level was evaluated by R2-marker. The P-value determined whether a QTL was associated with the marker or not and the R2-marker evaluated the magnitude of the QTL effects.
Results
Genetic diversity and phenotypic data
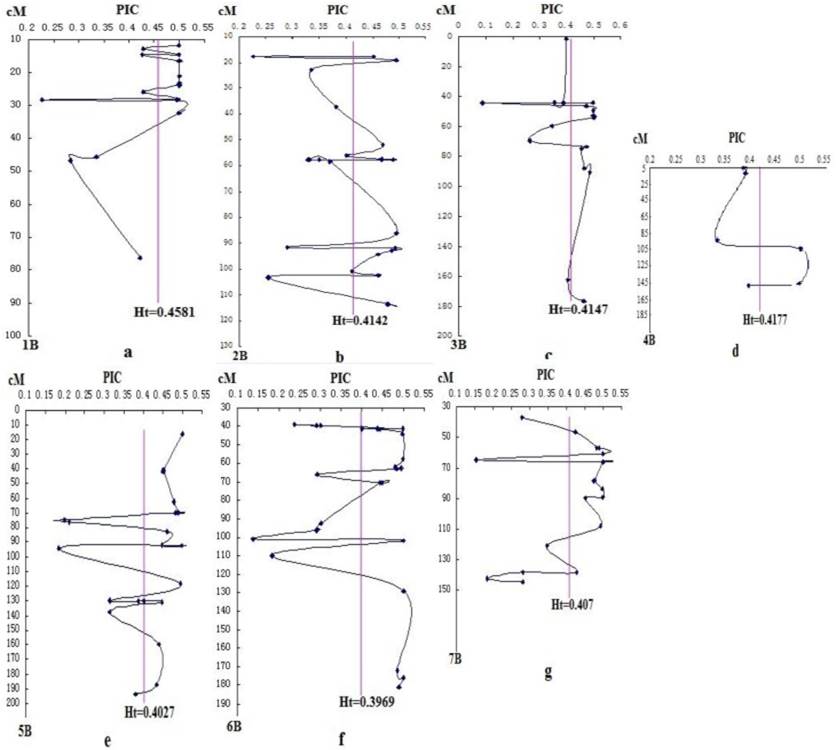
DArT analysis produced 462 bi-allelic markers with corresponding PIC values ranging from 0.088 to 0.5, with a mean of 0.412. However, due to some markers with unknown position and the elimination of rare alleles and markers with more than 10% of missing values, only 139 DArT markers located on B-genome were kept for further analysis. The average PIC value was 0.416. Within these chromosomes, 1B has the highest PIC value of 0.458, followed by 3B (0.415), while 6B has the lowest PIC value of 0.397 (Fig. 1 ).
The PIC distributions in the seven chromosomes of B-genome were uneven. Linking the PIC values of DArT markers on the same chromosome with the line, we found that different degrees of "V" shaped valley in each chromosome (Fig. 1). The Ht vertical bar shows the average PIC value of DArT markers on each chromosome. Among them, some DArT markers with relatively low PIC, located in the following of Ht line, often in the "V" shaped bottom. According to the hitchhiking effect mapping principle, many genes controlling important agronomic traits should exist near the "V" shaped valley.
All statistical analyses of thirteen agronomic important characters phenotypic data were carried out using SAS 8.0. The trait names, means, ranges, and broad sense heritability were presented in Table 1. A broad range of variance existed in nearly all 13 traits measured in this diverse collection.
Descriptive statistics and phenotypic variation explained by population structure for 13 traits.
| Traita | Mean | SD | Minimum | Maximum | H2 | R2b |
|---|---|---|---|---|---|---|
| PH | 84.53 | 13.52 | 57.64 | 135.66 | 84.4 | 6.13 |
| SL | 9.10 | 1.78 | 5.42 | 14.5 | 98.05 | 11.49 |
| FIITL | 11.35 | 3.87 | 4.07 | 22.6 | 56.4 | 5.22 |
| TSN | 18.63 | 1.31 | 15.44 | 22.67 | 96.55 | 3.44 |
| FSN | 17.27 | 1.32 | 14.33 | 22.11 | 93.77 | 4.85 |
| SSN | 1.38 | 0.58 | 0 | 4 | 55.88 | 2.43 |
| SD | 224.76 | 64.24 | 149.94 | 488.31 | 92.02 | 6.65 |
| GN | 45.14 | 13.48 | 31.67 | 163.33 | 96.58 | 5.36 |
| GW | 1.95 | 0.39 | 0.5 | 3.62 | 87.95 | 2.45 |
| TKW | 46.0 | 6.20 | 23.2 | 58.21 | 91.68 | 5.59 |
| FL | 22.21 | 5.68 | 13.95 | 57.05 | 89.12 | 7.8 |
| KDb | 3.17 | 0.14 | 2.81 | 3.57 | 80.34 | 1.21 |
| KHb | 52.27 | 11.51 | 30.87 | 80.67 | 98.93 | 13.05 |
a List these traits (such as PH = plant height) here. All traits were measured in five years (2006-2010) except KD and KH which were measured in three years (2008-2010).
b Percentage of phenotypic variation explained by population structure.
The broad-sense heritability for each agronomic trait was estimated (Table1). The H2 values for TKW, FSN, GN, SL, SD, TSN, and KH were all>90%. Heritabilities for the other traits (list the traits here) ranged from 55.88% for SSN to 89.12% for FL.
Changes of genetic diversity of chromosomes 1B - 7B (a-g) indicated by PIC at DArT loci. The chart was drawn mainly on the genetic map of Crossa et al. [10]. The erect line is Ht of the seven chromosomes of B-genome.
Population structure
Population structure was also an important factor in phenotypic variation. As illustrated in Table 1, only a small part of the phenotypic variation for any trait was due to the presence of subpopulations, with an average of 5.82% across all traits. SL and KH were highly affected by population structure, with more than 10% of the variation attributable to it. Other traits were less affected by population structure. Population structure accounted for the lowest percentage (1.21%) of phenotypic variation for KD.
The analysis of population structure was inferred with the STRUCTURE 2.2 software. According to the method of Evanno et al. [24], △K was plotted against the number of sub-populations K. The maximum value of △K occurred at K=4, such that k=4 (four subpopulations) was defined to provide the optimal structure. Fst between subpopulations were also calculated. The Fst between pairs of subpopulations ranged between 0.0336 and 0.126, indicating moderate differentiation.
Linkage disequilibrium
Of the 139 polymorphic DArT markers with known a map position, only 3 markers were filtered out account of a minimum allele frequencies (MAF) lower than 0.1 in order to prevent the detection of spurious LD. In the collection of 109 wheat accessions, the 95 percentile of the distribution of unlinked r2 pairs was estimated 0.0703. It was estimated that the values of r2>0.0703 were probably due to genetic linkage according to the research of Breseghello and Sorrells [7].
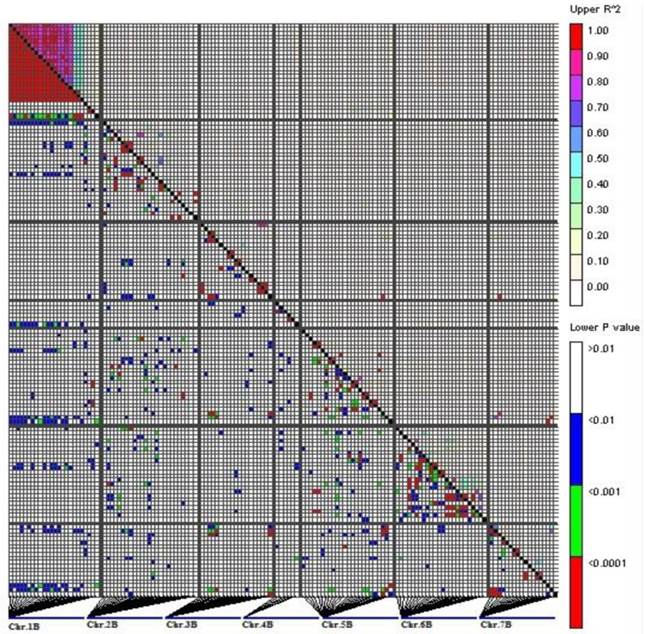
In total, 9.46% of the intra-chromosomal marker pairs showed a significant level of LD (P<0.01), while the marker pairs in LD were reduced to 3.66% when P value was less than 0.0001. Most of the significant marker pairs in LD were on chromosome 1B (Fig. 2).
The patterns of synthetic LD were studied in the seven chromosomes of B-genome. On 1B, 22 markers covered most of the chromosome with 10 cM marker interval on average based on the Crossa et al. [10]. The pairwise r2 varied from 0 to 1 with a median of 0.552. About 76% of pairwise estimates r2 were above the baseline of 0.0703. The result of LD decay curve showed that LD extends 22 cM (Fig. 3). The extensive LD was due to an LD block observed on 1B, including 19 loci within 20.6 cM (positions 11.7-32.3cM, Fig. 4). The pairwise r2 of the markers in the LD block were higher than 0.0703 and showed significant LD (P<0.001) among the 109 wheat accessions. Twenty one complete LD (r2 =1 with P=0) between loci were observed.
LD measurements (r2, above the diagonal line) and probability value (P, below the diagonal line) for 139 DArT markers located on B-genome (1B-7B) on 109 varieties. The picture represents all pair-wise comparisons of polymorphic sites. The genetic map locations of DArT markers are shown in Fig 4.
Estimates of r2 versus linkage distance on seven chromosomes of B-genome. Horizontal straight lines indicate the 95 percentile of the distribution of unlinked r2.
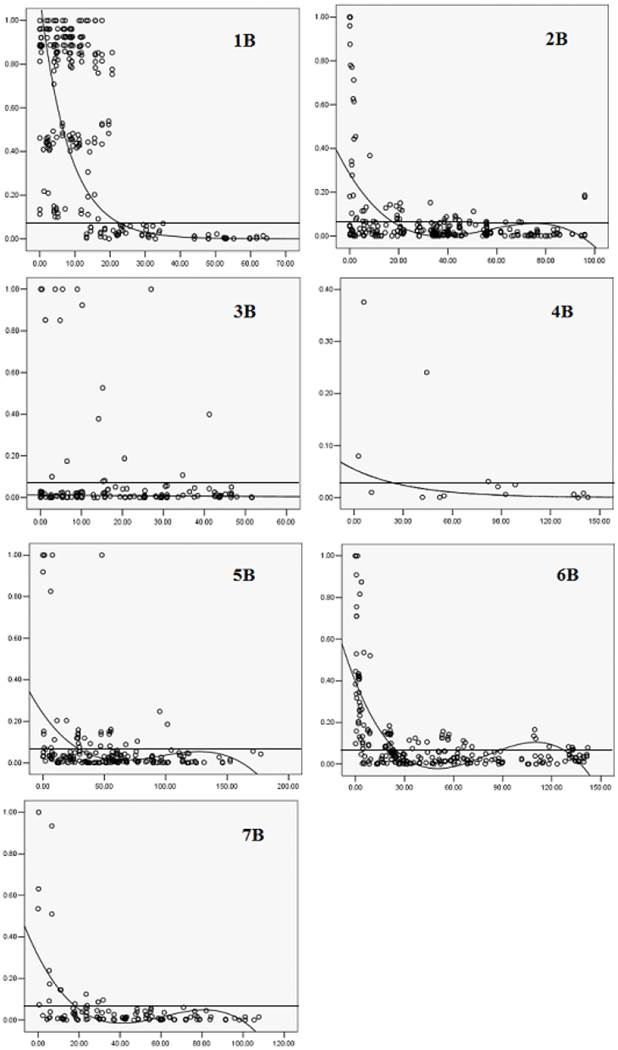
Twenty five DArT markers covered most of the chromosome 2B and the mean of pairwise r2 was 0.0718. About 15.72% of pairwise estimates r2 were above the baseline of 0.0703, the extent of LD in this part of 2B was about 18 cM (Fig. 3). Three LD blocks were observed, one was in the short arm including seven loci within 16.4 cM (position 86.1- 102.5 cM, Fig. 4). The two other LD blocks included four loci in 5.1 cM (position 17.7-22.8 cM, Fig. 4) and eight loci in 2.4 cM (position 56.1- 58.5 cM, Fig. 4). Pairwise estimates of r2 on 3B varied from 0 to 1, with a median of 0.0753. Although 12.35% of estimates were above the baseline of 0.0703, a loess curve that fitted the r2 estimates did not reach the baseline (Fig. 3), indicating that the marker density was not sufficient to detect consistent LD. Most pair-wise significant r2 estimates on 3B were observed toward the ends of the chromosome, whereas in the short arm eleven markers within 10.2 cM (position 44-5.2 cM, Fig. 4) exhibited inconsistent LD.
Significant markers were shown for plant height (PH, cm), spike length (SL), the first internode length counted from the top (FIITL, cm), total spikelet number per spike (TSN), fertile spikelet number (FSN), sterile spikelet number (SSN), spike density (SD), grain number per spike (GN), grain weight per spike (GW), thousand-kernel weight (TKW), flag leaf (FL, cm2), kernel diameter (KD), kernel hard (KH). The approximate position of the centromere for each chromosome is marked with a ⇒ symbol.
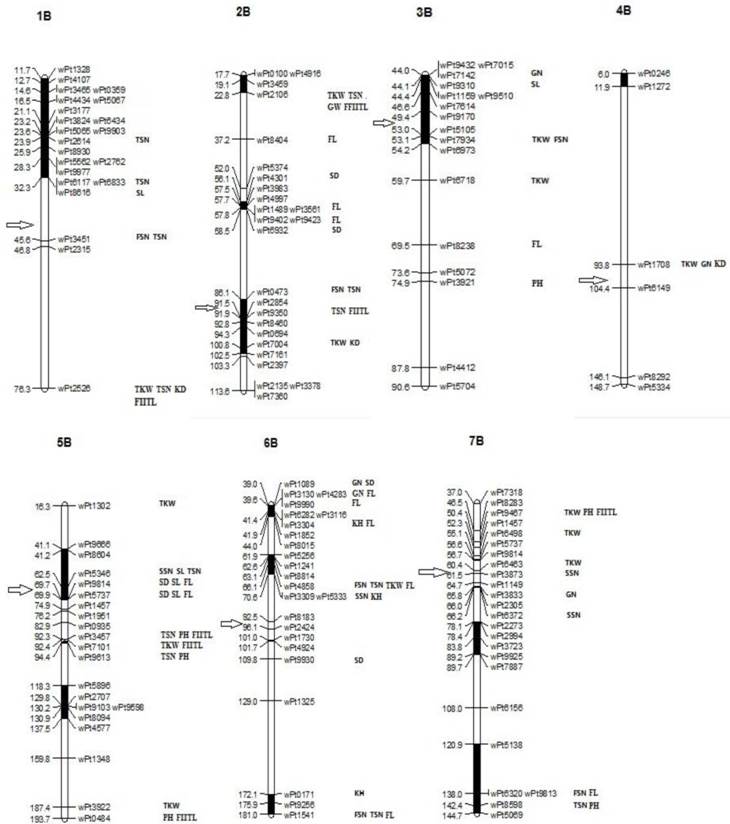
Few markers located on 4B, and the pairwise r2 varied from 0 to 0.38 with a median of 0.054. About 20% of pairwise estimates r2 were above 0.0703. One LD block was found on chromosome 4B which was in the terminal region including two loci within 5.9 cM (position 6.0-11.9 cM, Fig. 4). Pairwise r2 estimates varied from 0 to 1 for markers on 5B, 6B and 7B, the median r2 value was 0.066, 0.109 and 0.06, respectively. There were 18.12%, 34.42% and 14.84% of pairwise estimates r2 above the baseline of 0.0703 for the three chromosomes, LD blocks were also found (Fig. 4), the extent of LD on chromosome 5B, 6B, and 7B was about 27, 25 and 18 cM (Fig. 3).
Association mapping
Marker-trait association was tested through the mixed linear model. Based on the critical P-value less than 0.01 with 139 markers for traits, we identified 84 marker-trait associations (MTAs) involving 47 DArT markers distributed on the seven chromosomes of B-genome for 13 traits and the R2 ranges from 0.19 to 21.42%. The 47 associated mapped markers were included in the genetic map shown in Fig. 4. Among the MTAs, 23 were specific for single traits, and the rest consisted of associations of up to four traits.
TKW and TSN were involved in the highest number of MTAs (13 each), distributing on the seven chromosomes and five chromosomes (without 3B and 4B), respectively, followed by FL (12). The fewest MTAs were associated with GW (1). Each trait was associated with at least one (GW and KH) and the maximum seven (TKW) chromosomes.
The highest number of associated markers was found on chromosome 5B (20), followed by 6B (18), with the least on 4B (only 3).
There were seven markers significantly associated with FIITL (P<0.01) and wPt-3457 (5B, 92.3 cM) had the highest R2 (21.42%). TKW was significantly associated with 13 markers with R2 ranged from 0.23% to 12.43%. The 13 MTAs identified for TKW were spread over chromosomes 1B (76.3cM)), 2B (22.8, 100.8cM)), 3B (53.1, 59.7cM)), 4B (93.8cM)), 5B (16.3cM), 92.4cM), 187.4cM)), 6B (66.1cM)), 7B (50.4cM), 55.1cM), 60.4cM)). TSN was significantly associated with 13 markers and their R2 ranged from 6.15% to 11.29%.
The strong phenotypic correlation between TSN and FSN was reflected in the larger number of shared MTAs for the two traits (13 and 6, respectively). FSN and TSN shared four MTAs. They are located on 1B (45.6cM)), 2B (86.1cM)) and 6B (66.1cM), 181cM)). Another MTAs for FSN were identified on 3B (53.1cM)) and 7B (138cM)). The other associated markers for TSN were found on 1B (23.9cM), 32.3cM), 76.3cM)), 2B (22.8cM), 91.9cM)), 5B (62.5cM), 92.3cM), 94.4cM)) and 7B (142.4cM)).
PH and FIITL shared MTAs too. They were found on 5B (92.3cM), 193.7cM)), 7B (50.4cM)). The PH-specific MTAs were identified on 3B (74.9cM)), 5B (94.4cM)) and 7B (142.4cM)). The FIITL-specific MTAs were found on 1B (76.3cM)), 2B (22.8cM), 91.9cM)) and 5B (92.4cM)).
For other spike traits, several MTAs where SL was involved were identified on 1B (32.3cM)), 3B (44.1cM)) and 5B (62.5cM), 69.7cM), 69.9cM)). For SSN, we identified 16 associated markers on 5B (62.5cM)), 6B (70.6cM)) and 7B (61.5cM), 66.2cM)). Most of the MTAs where SD was involved are identified on 2B (56.1cM), 58.5cM)), 5B (69.7cM), 69.9cM)) and 6B (39cM), 109.8cM)). For GN, we found five associated markers on 3B (44.0cM)), 4B (93.8cM)), 6B (39cM), 39.6cM)) and 7B (65.8cM)). For GW, the markers were on 2B (22.8cM)).
For the kernel traits, MTAs-markers of KD located on chromosome 1B (76.3cM)), 2B (100.8cM)) and 4B (93.8cM)). For KH, only three MTAs were identified, which were located on 6B (41.4cM), 70.6cM), 172.1cM)).
The associated markers for FL were located on 2B (37.2cM), 57.8cM)), 3B (89.5cM)), 5B (69.7cM), 69.9cM)), 6B (39.6cM), 41.4cM), 66.1cM), 181cM)), and 7B (138cM)).
Overall, chromosome 1B impacted major traits related to spikes, such as TSN, FSN. 2B impacted TKW, markers on this chromosome mainly associated with TKW, TSN, FL and SD. 3B mainly affected TKW. 4B was associated with TKW, kernel traits, etc. There were many traits affected by markers on 5B, mainly TKW, PH, FIITL, SL, SD, TSN and FL. Chromosome 6B mainly affected FL, kernel traits, spikelet numbers; and 7B mainly affected TKW, PH, etc.
Discussion
Genetic diversity of B-genome and hitchhiking effects
Wheat is an allohexaploid species, it possesses three sets of homoeologous chromosomes, designated as AA, BB and DD. Genetic diversity is the basis for wheat improvements, B-genome has the highest polymorphism [26-28]. Garland et al. [29] and Varshney et al. [30] reported a number of agronomic QTL on chromosomes of B-genome.
Zhang et al. [31] proved that there were many "V" shaped valley selected in the process of wheat domestication and breeding. Marker/trait association analysis based on hitchhiking effects was to find the most valuable genes/QTL correlating with important agronomic traits. Hitchhiking effect usually reduced significantly the diversity in target sites and flanking sequences, increased LD of the genomic segment and unbalanced the allelic distribution. These signs occurred in offspring groups often retain a certain period of time. Therefore, by scanning founder parent offspring, we may find many "V" shaped valleys, near which the genes that control important traits should exist [32]. For example, TSN was selected by people on their purpose, so the genetic diversity reflected by polymorphism information content of closely linked markers was low.
In our study, there were many markers on the bottom of "V" shaped valleys identified indeed associated with important agronomic traits. For example, marker wPt-3451 associated with TSN and FSN was found on the bottom. Similarly, the markers wPt-2106, wPt-8404, wPt-3561, wPt-9402 on 2B, wPt-7142, wPt-8238 on 3B, wPt-1708 on 4B, wPt-9613 on 5B, wPt-4858, wPt-9930 on 6B, and wPt-8598 on 7B around the bottom of "V" shaped valley were all associated with agronomic traits. There were many markers around these above markers in the "V" shaped valley also associated with important traits. Genome segment containing markers positioned on the "V" shaped valley, especially the markers on the bottom should be research focus in future. Combined with association analysis results, hitchhiking effects mapping was indeed effective. Contrarily, if we want to find chromosome segments with high genetic diversity, markers above the Ht could be used.
LD in wheat collections
LD distribution across chromosomes may significantly affect the power of association mapping and effectiveness of marker-assisted breeding. Usually, a high level of LD in many chromosome regions of the population suggests that association mapping can be an effective method for QTL identification and validation in these regions. Low LD observed in majority of each genome suggests that map resolution can be improved in many important regions of chromosomes by association mapping.
However, varied LD levels were observed across chromosomes or genomes. Somers et al. [18] suggested that the changes in LD along chromosomes are indicative of areas of genome that are under selection pressure. LD declined within approximately 40 cM in CIMMYT bread wheat germplasm. Previous wheat association studies suggested different LD levels on different chromosomes. Breseghello and Sorrells [7] observed an overall LD decay within 5 cM for LD caused by genetic linkage on chromosome 5A and a decay <1 cM on 2D in a population of 95 soft winter wheat lines. LD that declined below r2=0.1 within 0.5 cM on chromosome 3B was found in 44 modern European winter wheat cultivars [11]. Yao et al. [12] found that LD extends 2.3 cM on chromosome 2A. In our study, the result indicated that LD decays at 18-27 cM in the seven chromosomes of B-genome. The genetic distances used for LD calculations in this study were based on the consensus map [10], and thus the distances may not reflect actual genetic distances in the population. Further, actual LD may differ among populations and needed to be evaluated for each population [7].
The r2 of unlinked loci was at 0.0703 which was similar to 0.07 found by Yao et al. [12]. Though this value was similar, the extent of LD was higher than their study. This may result from the much higher marker density which gives more opportunities to detect more cases of high inter-chromosomal LD.
Several LD blocks were detected in our study, and similar LD block regions were also found by Crossa et al. [10] and Neumann et al. [13]. The PIC values of most markers in LD blocks were often lower than Ht mean value. Important traits were selected by people many times, so the PIC value of markers associated with traits were low, while the frequency of different marker alleles appeared at the same time was higher than random combinations after repeated selections, so they were also in LD.
Marker-trait association
A first genome-wide association maps in wheat exploiting DArT marker technology was published by Crossa et al. [10]. DArT markers have been effectively used in studying crops [13, 33-34]. The agronomic traits which affect crop yield in bread wheat are complex and controlled by a larger number of major and minor QTL [35]. Dispersion of genes affecting GY (grain yield) across the wheat genome appears to be a characteristic feature [36], that was also observed in this study. Several DArT markers on different chromosomes were significant for various traits. Many of the DArT markers were found to be significantly associated with the grain yield map regions previously reported for these traits [10, 13].
Many markers were identified to be associated with certain traits evaluated in different years which might have different environment conditions. For example, wPt-3921 on 3B associated with PH, wPt-1302 on 5B associated with TKW (R2, 10.15%), wPt-3457 on 5B associated with PH (R2, 10.8%) and FIITL (R2, 19.12%), wPt-9613 on 5B associated with FIITL (R2, 8.8%) and wPt-9467 associated with PH (R2, 14.96%) were found in least three years. There were also some markers found at very significance levels. For example, wPt-1708 on 4B was associated with TKW (R2, 12.43%) and GN (R2, 11.74%) at P<0.0001; wPt-5346 on 5B was associated with SSN (R2, 10.74%) at P<0.0001 and wPt-4858 on 6B was associated with FSN (R2, 11.97%) and TSN (R2, 11.29%) at P<0.001.
Considering the test significant levels, multiple year (environment) marker-trait associations, important markers in LD blocks and hitchhiking effect mapping, we identified markers wPt-1708 (4B, 93.8cM)), wPt-3457 (5B, 92.3cM)), wPt-9613 (5B, 94.4cM)), wPt-4858 (6B, 66.1cM)) and wPt-8598 (7B, 142.4cM)) for further studies.
Taking into account the markers number, polymorphism level, the trait-associated marker number, here we only studied markers on B-genome in this paper. Markers on A-genome and D-genome associated with important traits will be studied in other papers.
Conclusion
In summary, we evaluated important agronomic traits of 109 wheat accessions in a 3-5-year study at Tai'an of China and identified potential DArT markers for these traits using an association mapping approach. The extent of LD on the seven chromosomes of B-genome was about 18-27 cM. We used mixed linear model approach to discover loci associated with agronomic traits in wheat, and found 84 significant MTAs. Combined with hitchhiking effects, we found some important genome segments and marker loci on the chromosomes of B-genome for future analysis. Our results proved that association mapping is a promising method for mapping plant traits. Markers identified in this study should be useful for marker-assisted selection in wheat breeding programs.
Acknowledgements
This research was supported by the National Natural Science Foundation of China (No. 30971764 and No. 31171554), the National Basic Research Program of China (2009CB118301), the National Major Projects of Cultivated Transgenic New Varieties Foundation of China (2008ZX08002-004 and 2009ZX08002-017B).
Competing Interests
The authors have declared that no competing interest exists.
References
1. Gupta PK, Rustgi S, Kulwal PL. Linkage disequilibrium and association studies in higher plants:Present status and future prospects. Plant Molecular Biology. 2005;57:461-485
2. Thornsberry JM, Goodman MM, Doebley J, Kresovich S, Nielsen D, Buckler ES. Dwarg8 polymorphisms associate with variation in flowering time. Nat Genet. 2001;28:86-289
3. Tenaillon MI, Sawkins MC, Ankhony D, Long A.D, Gaut RL, Doebley JF, Gaut BS. Patterns of DNA sequence polymorphism along chromosome 1 of maize (Zea mays ssp. Mays L.). Proc Natl Acad Sc USA. 2001;98:9161-9166
4. Remington DL, Thornsberry JM, Matsuola Y, Wilson LM, Whitt SR, Doebley J, Kresovich S, Goodman MM, Buckler IV ES. Structure of linkage disequilibrium and phenotypic associations in the maize genome. Proc Nalt Acad Sci USA. 2001;98:1479-11484
5. Wang RH, Yu YT, Zhao JR, Shi YS, Song YC, Wang TY, Li Y. Population structure and linkage disequilibrium of a mini core set of maize inbred lines in China. Theor Appl Genet. 2008;117:1141-1153
6. Kraakman ATW, Martinez F, Mussirliev B, Eeuwijk FA, Niks RE. Linkage disequilibrium mapping of morphological, resistance, and other agronomically relevant traits in modern spring barley cultivars. Mol Breed. 2004;17:41-58
7. Breseghello F, Sorrells ME. Association mapping of kernel size and milling quality in wheat (Triticum aestivum L.) cultivars. Genetics. 2006;172:1165-1177 doi:10.1534/genetics.105.044586
8. Sanguineti MS, Li M, Maccaferri S, Corneti F. et al. Genetic dissection of seminal root architecture in elite durum wheat germplasm. Ann Appl Biol. 2007;151:291-305
9. Ravel C, Praud S, Murigneux A, Linossier L, Darderet M, Balfourier F, Dufourier F, Dufour P, Brunet D, Charmet G. Identification of Glu-B1-1 as a candidate gene for the quantity of high molecular-weight glutenin in bread wheat (Triticum aestivum L,) by means of an association study. Theor Appl Gent. 2006;112:738-743
10. Crossa J, Burgueno J, Dreisigacker S, Vargas M, Herrera-Foessel SA, Lillemo M. et al. Association analysis of historical bread wheat germplasm using additive genetic covariance of relatives and population structure. Genetics. 2007;177:1889-1913
11. Tommasini L, Schnurbusch T, Fossati D, Mascher F, Keller B. Association mapping of Stagonospora nodorum blotch resistance in modern European winter wheat varieties. Theor Appl Genet. 2007;115:697-708
12. Yao J, Wang L, Liu L, Zhao C, Zheng Y. Association mapping of agronomic traits on chromosome 2A of wheat. Genetica. 2009;137:67-75
13. Neumann K, Kobiljski B, Dencic S, Varsheny RK, Borner A. Genome-wide association mapping: a case study in bread wheat (Triticum aestivum L). Mol Breeding. 2011;27:37-58
14. Flint-Garcia SA, Thornsberry JM, Buckler ES IV. Structure of linkage disequilibrium in plants. Annu Rev Plant Biol. 2003;54:357-374
15. Rafalski J A. Novel genetic mapping tools in plant: SNP and LD-based approaches. Plant Sci. 2002;162:329-333
16. Maccaferri M, Sanguineti MC, Noli E, Tuberosa R. Population structure and long-range linkage disequilibrium in a durum wheat elite collection. Mol Breed. 2005;15:271-290
17. Chao S, Zhang W, Dubcovsky J, Sorrels ME. Evaluation of genetic diversity and genome-wide linkage disequilibrium among US wheat (Triticum aestivum.) germplasm representing different mark classes. Crop Sci. 2007;47:1018-1030
18. Somers DJ, Banks T, DePauw R, Fox S, Clarke J, Poznial C, McCartney C. Genome-wide linkage disequilibrium analysis in bread wheat and durum wheat. Genome. 2007;50:557-567
19. Sharp PG, Kreis M, Shewry PR, Gale MD. Resistance to Puccinia recondite tritici in synthetic hexaploid wheats. Indian j Genet. 1988;58:263-269
20. Liu K, Muse SV. PowerMarker: Integrted analysis environment for genetic marker data. Bioinformatics. 2005;21:2128-2129
21. Nei M, Tajima F A. Tateno. Accuracy of estimated phylogenetic trees from molecular data. Journal of Molecular Evolution. 1983;19:153-170
22. Pritchard JK, Stephens M, Donnelly P. Identifying population structure using multilocus genotype data. Genetics. 2000;155:945-959
23. Falush D, Stephens M, Pritchard JK. Inference of population structure using multilocus genotype data:linked loci and correlated allele frequencies. Genetics. 2003;164:1567-1587
24. Evanno G, Regnaut S, Goudet J. Detecting the number of clusters of individuals using the software STRUCTURE: a simulation study. Mol Ecol. 2005;14:2611-2620
25. Yu J, Pressoir G, Briggs WH, Bi IV, Yamasaki M, Doebley JF, McMullen MD, Gaut BS, Nielsen DM, Holland JB, Kresovich S, Buckler ES. A unified mixed-model method for association mapping that accounts for multiple levels of relatedness. Nature Genetics. 2006;38:203-208
26. Jia JZ. Review of wheat molecular markers. Biology Technique Aviso. 1997;2:1-5
27. Gao MQ, Liu DC, Guo XL, Zhang AM. The study of SSR markers of part of new Chinese winter wheat. Agriculture Biology Technique Transaction. 2001;9(1):49-54
28. Hao CY, Wang LF, Zhang XY, You GX, Dong YC, Jia JZ, Liu X, Shang XW, Liu SC, Cao YS. The genetic diversity evolvement of raised wheat varietals. Science of China Ser. C. 2005;35(5):408-415
29. Garland T, Midford PE, Ives AR. An introduction to phylogenetically based statistical methods, with a new method for confidence intervals on ancestral values. American Zoologist. 1999;39(2):374-388
30. Varshney RK, Prasad M, Poy JK, Harjit-Singh NK, Dhaliwal HS, Balyan HS, Gupta PK. Identification of eight chromosomes and a microsatellite marker on 1AS associated with QTL for grain weight in bread wheat. Theor Appl Genet. 2000;100(8):1290-1294
31. Zhang XY, Tong YP, You GX, Hao CY, Ge HM, Wang LF, Li B, Dong YC, Li ZS. Hitchhiking effect mapping: a new approach for discovering agronomic important genes. Agricultural Sciences in China. 2007;6(3):255-264
32. Rafalski A, Morgante M. Corn and humans: recombination and linkage disequilibrium in two genomes of similar size. Genetics. 2004;20(2):103-110
33. Mantovani P, Maccaferri M, Sanguineti MC, Catizone RT, Wenzl P, Thomsom B, Carling J, Huttner E, Ambrogio ED, Kilian A. An integrated DArT-SSR linkage map of durum wheat. Mol Breeding. 2008;22:629-648
34. Zhang LY, Marchand S, Tinker NA, Belzile F. Population structure and linkage disequilibrium in barley assessed by DArT markers. Theor Appl Genet. 2009Jun;119(1):43-52
35. Kumar N, Kulwal PL, Balyan HS, Gupta PK. QTL mapping for yield and yield contribution traits in two mapping populations of bread wheat. Mol Breed. 2007;19:163-177
36. Laperche A, Brancourt-Hulme M, Heumez E, Gardet O, Hanson E. et al. Using genotype x nitrogen interaction variables to evaluate the QTL involved in wheat tolerance to nitrogen constraints. Theor Appl Genet. 2007;115:399-415
Author contact
![]() Corresponding author: jctianedu.cn
Corresponding author: jctianedu.cn
Published 2014-1-10